The latest officially reported population of Norway was 5,610,870 in 2025 vs 21,913,874 people in Zambia in 2025. In 2026, based on the adjusted UN estimation, the current Norway's population is 5,660,666 people compared to 22,844,606 in Zambia.
Population statistics:
- Zambia's population is 4.04 times bigger than Norway's.
- Norway is ranked the 119th most populous country in the world, while Zambia is the 62nd.
- The countries together account for 0.34% of the world: 0.07% for Norway vs 0.27% for Zambia.
- For the last 10 years, Norway has had an average growth rate of +0.81% per year vs +2.96% in Zambia.
- Since 2006, the population of Norway has increased from 4.66M people to 5.66M (21.5% growth), while Zambia has grown from 12.1M to 22.8M (88.3% growth).
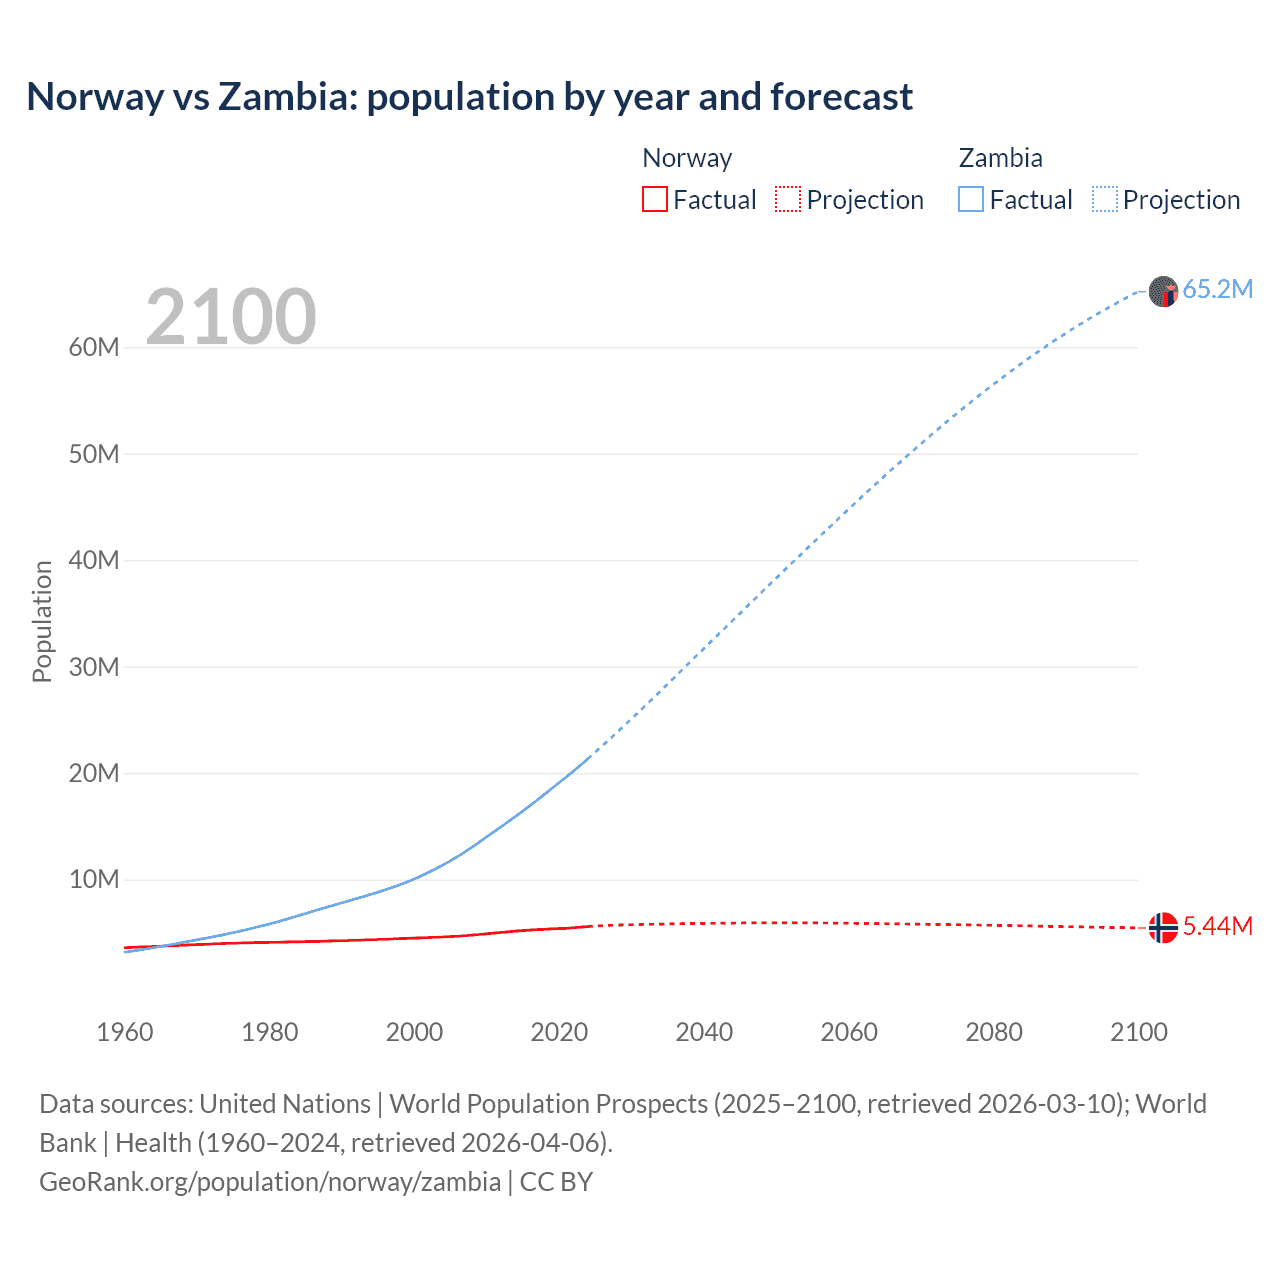
Norway vs Zambia: population by year and forecast
| Year | Population | |
|---|---|---|
 Norway
|
 Zambia
|
|
| 2100 | 5,426,970 | 65,204,593 |
| 2099 | 5,439,664 | 64,858,778 |
| 2098 | 5,451,717 | 64,503,193 |
| 2097 | 5,463,190 | 64,136,110 |
| 2096 | 5,474,994 | 63,764,760 |
| 2095 | 5,487,368 | 63,380,692 |
| 2094 | 5,499,514 | 62,980,254 |
| 2093 | 5,512,056 | 62,578,008 |
| 2092 | 5,524,021 | 62,163,693 |
| 2091 | 5,535,989 | 61,738,437 |
| 2090 | 5,548,825 | 61,309,330 |
| 2089 | 5,561,462 | 60,868,166 |
| 2088 | 5,574,757 | 60,422,781 |
| 2087 | 5,588,831 | 59,958,303 |
| 2086 | 5,602,569 | 59,487,524 |
| 2085 | 5,616,010 | 59,011,423 |
| 2084 | 5,629,675 | 58,524,337 |
| 2083 | 5,642,568 | 58,029,088 |
| 2082 | 5,654,975 | 57,527,347 |
| 2081 | 5,666,885 | 57,016,267 |
| 2080 | 5,678,624 | 56,495,299 |
| 2079 | 5,689,711 | 55,972,223 |
| 2078 | 5,700,349 | 55,438,864 |
| 2077 | 5,710,483 | 54,895,964 |
| 2076 | 5,720,209 | 54,350,375 |
| 2075 | 5,729,904 | 53,796,265 |
| 2074 | 5,739,940 | 53,236,297 |
| 2073 | 5,749,872 | 52,666,980 |
| 2072 | 5,759,499 | 52,090,884 |
| 2071 | 5,768,298 | 51,509,551 |
| 2070 | 5,777,747 | 50,921,590 |
| 2069 | 5,786,471 | 50,324,793 |
| 2068 | 5,795,734 | 49,727,689 |
| 2067 | 5,805,627 | 49,125,817 |
| 2066 | 5,815,585 | 48,520,891 |
| 2065 | 5,825,356 | 47,909,160 |
| 2064 | 5,835,081 | 47,290,430 |
| 2063 | 5,844,519 | 46,668,252 |
| 2062 | 5,853,646 | 46,039,755 |
| 2061 | 5,861,677 | 45,407,718 |
| 2060 | 5,869,390 | 44,768,534 |
| 2059 | 5,875,920 | 44,128,619 |
| 2058 | 5,881,790 | 43,485,891 |
| 2057 | 5,888,181 | 42,843,489 |
| 2056 | 5,894,125 | 42,198,591 |
| 2055 | 5,899,106 | 41,550,105 |
| 2054 | 5,903,121 | 40,898,440 |
| 2053 | 5,906,126 | 40,247,706 |
| 2052 | 5,907,281 | 39,596,094 |
| 2051 | 5,907,735 | 38,942,292 |
| 2050 | 5,907,355 | 38,287,070 |
| 2049 | 5,905,940 | 37,626,787 |
| 2048 | 5,903,025 | 36,964,032 |
| 2047 | 5,899,964 | 36,302,603 |
| 2046 | 5,896,254 | 35,638,852 |
| 2045 | 5,891,177 | 34,974,927 |
| 2044 | 5,886,031 | 34,310,227 |
| 2043 | 5,880,486 | 33,645,797 |
| 2042 | 5,873,632 | 32,984,164 |
| 2041 | 5,865,604 | 32,323,084 |
| 2040 | 5,857,447 | 31,658,029 |
| 2039 | 5,848,023 | 30,995,204 |
| 2038 | 5,837,628 | 30,329,691 |
| 2037 | 5,826,752 | 29,662,721 |
| 2036 | 5,815,042 | 28,994,556 |
| 2035 | 5,802,966 | 28,327,922 |
| 2034 | 5,790,086 | 27,665,749 |
| 2033 | 5,776,187 | 27,006,658 |
| 2032 | 5,761,261 | 26,351,393 |
| 2031 | 5,745,071 | 25,697,754 |
| 2030 | 5,728,104 | 25,050,285 |
| 2029 | 5,710,229 | 24,409,600 |
| 2028 | 5,691,155 | 23,776,128 |
| 2027 | 5,670,783 | 23,146,922 |
| 2026 | 5,649,981 | 22,525,308 |
| 2025 | 5,610,870 | 21,913,874 |
| 2024 | 5,572,279 | 21,314,956 |
| 2023 | 5,519,601 | 20,723,965 |
| 2022 | 5,457,127 | 20,152,938 |
| 2021 | 5,408,320 | 19,603,607 |
| 2020 | 5,379,475 | 19,059,395 |
| 2019 | 5,347,896 | 18,513,839 |
| 2018 | 5,311,916 | 17,973,569 |
| 2017 | 5,276,968 | 17,441,320 |
| 2016 | 5,234,519 | 16,914,423 |
| 2015 | 5,188,607 | 16,399,089 |
| 2014 | 5,137,232 | 15,895,315 |
| 2013 | 5,079,623 | 15,398,997 |
| 2012 | 5,018,573 | 14,913,629 |
| 2011 | 4,953,088 | 14,437,796 |
| 2010 | 4,889,252 | 13,965,594 |
| 2009 | 4,828,726 | 13,490,389 |
| 2008 | 4,768,212 | 13,021,324 |
| 2007 | 4,709,153 | 12,565,085 |
| 2006 | 4,660,677 | 12,129,553 |
| 2005 | 4,623,291 | 11,718,819 |
| 2004 | 4,591,910 | 11,338,198 |
| 2003 | 4,564,855 | 10,983,595 |
| 2002 | 4,538,159 | 10,647,949 |
| 2001 | 4,513,751 | 10,325,185 |
| 2000 | 4,490,967 | 10,017,631 |
| 1999 | 4,461,913 | 9,740,005 |
| 1998 | 4,431,464 | 9,482,408 |
| 1997 | 4,405,157 | 9,237,063 |
| 1996 | 4,381,336 | 9,004,053 |
| 1995 | 4,359,184 | 8,785,763 |
| 1994 | 4,336,613 | 8,576,269 |
| 1993 | 4,311,991 | 8,373,921 |
| 1992 | 4,286,401 | 8,176,680 |
| 1991 | 4,261,732 | 7,981,650 |
| 1990 | 4,241,473 | 7,786,169 |
| 1989 | 4,226,901 | 7,589,216 |
| 1988 | 4,209,488 | 7,391,440 |
| 1987 | 4,186,905 | 7,191,282 |
| 1986 | 4,167,354 | 6,986,471 |
| 1985 | 4,152,516 | 6,780,953 |
| 1984 | 4,140,099 | 6,580,490 |
| 1983 | 4,128,432 | 6,381,038 |
| 1982 | 4,114,787 | 6,178,637 |
| 1981 | 4,099,702 | 5,983,289 |
| 1980 | 4,085,620 | 5,802,833 |
| 1979 | 4,072,517 | 5,631,728 |
| 1978 | 4,058,671 | 5,465,374 |
| 1977 | 4,043,205 | 5,302,480 |
| 1976 | 4,026,152 | 5,143,842 |
| 1975 | 4,007,313 | 4,990,086 |
| 1974 | 3,985,258 | 4,842,746 |
| 1973 | 3,960,612 | 4,702,693 |
| 1972 | 3,933,004 | 4,569,309 |
| 1971 | 3,903,039 | 4,442,525 |
| 1970 | 3,875,763 | 4,321,718 |
| 1969 | 3,847,707 | 4,197,116 |
| 1968 | 3,816,486 | 4,065,593 |
| 1967 | 3,784,539 | 3,936,343 |
| 1966 | 3,753,012 | 3,812,003 |
| 1965 | 3,723,168 | 3,692,086 |
| 1964 | 3,694,339 | 3,577,017 |
| 1963 | 3,666,537 | 3,465,907 |
| 1962 | 3,638,918 | 3,358,099 |
| 1961 | 3,609,800 | 3,254,086 |
| 1960 | 3,581,239 | 3,153,729 |
Data sources: United Nations | World Population Prospects (2026–2100, retrieved 2026-07-08); World Bank | Health (1960–2025, retrieved 2026-07-08).
GeoRank.org/population/norway/zambia | CC BY 
From 2006 to 2016, the population of Norway increased by 573,842 people (a 12.3% growth), while Zambia gained 4,784,870 people (a 39.4% growth).
For the next 10 years, from 2016 to 2026, Norway gained 426,147 people (a 8.14% growth), while Zambia's population increased by 5,930,183 people (a 35.1% growth).
Norway was ranked 116th most populous country in 2006 and is 119th in 2026. Zambia was ranked 71st in 2006 and ranked 62nd now.
The UN's World Population Prospects forecasts that in 24 years (in 2050) Norway's population will grow by 4.36% to 5,907,355 people with a rank change from 119th to 121st. The population of Zambia will increase by 67.6% to 38,287,070 people and rank change from 62nd to 54th.
Norway is projected to reach its peak in 2051 at 5.91M people compared to the peak of 65.2M people in 2100 for Zambia.
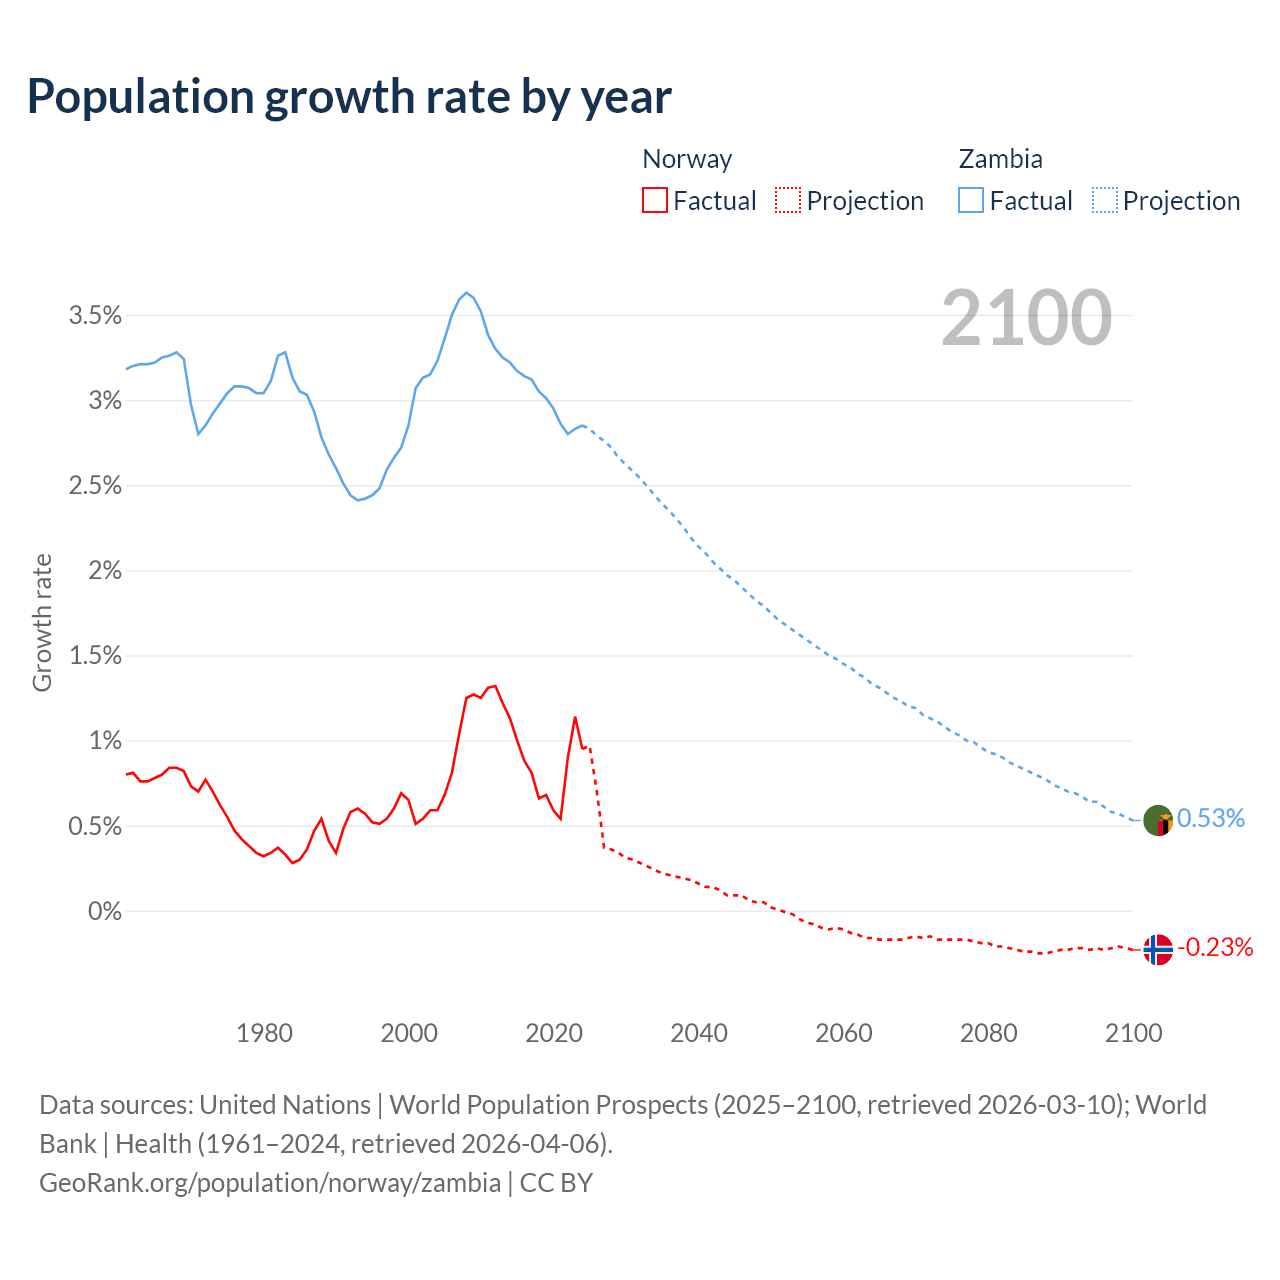
Population growth rate by year
| Year | Growth rate | |
|---|---|---|
|
Norway
|
Zambia
|
|
| 2100 | -0.23% | 0.53% |
| 2099 | -0.22% | 0.55% |
| 2098 | -0.21% | 0.57% |
| 2097 | -0.22% | 0.58% |
| 2096 | -0.23% | 0.61% |
| 2095 | -0.22% | 0.64% |
| 2094 | -0.23% | 0.64% |
| 2093 | -0.22% | 0.67% |
| 2092 | -0.22% | 0.69% |
| 2091 | -0.23% | 0.7% |
| 2090 | -0.23% | 0.72% |
| 2089 | -0.24% | 0.74% |
| 2088 | -0.25% | 0.77% |
| 2087 | -0.25% | 0.79% |
| 2086 | -0.24% | 0.81% |
| 2085 | -0.24% | 0.83% |
| 2084 | -0.23% | 0.85% |
| 2083 | -0.22% | 0.87% |
| 2082 | -0.21% | 0.9% |
| 2081 | -0.21% | 0.92% |
| 2080 | -0.19% | 0.93% |
| 2079 | -0.19% | 0.96% |
| 2078 | -0.18% | 0.99% |
| 2077 | -0.17% | 1% |
| 2076 | -0.17% | 1.03% |
| 2075 | -0.17% | 1.05% |
| 2074 | -0.17% | 1.08% |
| 2073 | -0.17% | 1.11% |
| 2072 | -0.15% | 1.13% |
| 2071 | -0.16% | 1.15% |
| 2070 | -0.15% | 1.19% |
| 2069 | -0.16% | 1.2% |
| 2068 | -0.17% | 1.23% |
| 2067 | -0.17% | 1.25% |
| 2066 | -0.17% | 1.28% |
| 2065 | -0.17% | 1.31% |
| 2064 | -0.16% | 1.33% |
| 2063 | -0.16% | 1.37% |
| 2062 | -0.14% | 1.39% |
| 2061 | -0.13% | 1.43% |
| 2060 | -0.11% | 1.45% |
| 2059 | -0.1% | 1.48% |
| 2058 | -0.11% | 1.5% |
| 2057 | -0.1% | 1.53% |
| 2056 | -0.08% | 1.56% |
| 2055 | -0.07% | 1.59% |
| 2054 | -0.05% | 1.62% |
| 2053 | -0.02% | 1.65% |
| 2052 | -0.008% | 1.68% |
| 2051 | 0.006% | 1.71% |
| 2050 | 0.02% | 1.75% |
| 2049 | 0.05% | 1.79% |
| 2048 | 0.05% | 1.82% |
| 2047 | 0.06% | 1.86% |
| 2046 | 0.09% | 1.9% |
| 2045 | 0.09% | 1.94% |
| 2044 | 0.09% | 1.97% |
| 2043 | 0.12% | 2.01% |
| 2042 | 0.14% | 2.05% |
| 2041 | 0.14% | 2.1% |
| 2040 | 0.16% | 2.14% |
| 2039 | 0.18% | 2.19% |
| 2038 | 0.19% | 2.25% |
| 2037 | 0.2% | 2.3% |
| 2036 | 0.21% | 2.35% |
| 2035 | 0.22% | 2.39% |
| 2034 | 0.24% | 2.44% |
| 2033 | 0.26% | 2.49% |
| 2032 | 0.28% | 2.54% |
| 2031 | 0.3% | 2.58% |
| 2030 | 0.31% | 2.62% |
| 2029 | 0.34% | 2.66% |
| 2028 | 0.36% | 2.72% |
| 2027 | 0.37% | 2.76% |
| 2026 | 0.7% | 2.79% |
| 2025 | 0.69% | 2.81% |
| 2024 | 0.95% | 2.85% |
| 2023 | 1.14% | 2.83% |
| 2022 | 0.9% | 2.8% |
| 2021 | 0.54% | 2.86% |
| 2020 | 0.59% | 2.95% |
| 2019 | 0.68% | 3.01% |
| 2018 | 0.66% | 3.05% |
| 2017 | 0.81% | 3.12% |
| 2016 | 0.88% | 3.14% |
| 2015 | 1% | 3.17% |
| 2014 | 1.13% | 3.22% |
| 2013 | 1.22% | 3.25% |
| 2012 | 1.32% | 3.3% |
| 2011 | 1.31% | 3.38% |
| 2010 | 1.25% | 3.52% |
| 2009 | 1.27% | 3.6% |
| 2008 | 1.25% | 3.63% |
| 2007 | 1.04% | 3.59% |
| 2006 | 0.81% | 3.5% |
| 2005 | 0.68% | 3.36% |
| 2004 | 0.59% | 3.23% |
| 2003 | 0.59% | 3.15% |
| 2002 | 0.54% | 3.13% |
| 2001 | 0.51% | 3.07% |
| 2000 | 0.65% | 2.85% |
| 1999 | 0.69% | 2.72% |
| 1998 | 0.6% | 2.66% |
| 1997 | 0.54% | 2.59% |
| 1996 | 0.51% | 2.48% |
| 1995 | 0.52% | 2.44% |
| 1994 | 0.57% | 2.42% |
| 1993 | 0.6% | 2.41% |
| 1992 | 0.58% | 2.44% |
| 1991 | 0.48% | 2.51% |
| 1990 | 0.34% | 2.6% |
| 1989 | 0.41% | 2.68% |
| 1988 | 0.54% | 2.78% |
| 1987 | 0.47% | 2.93% |
| 1986 | 0.36% | 3.03% |
| 1985 | 0.3% | 3.05% |
| 1984 | 0.28% | 3.13% |
| 1983 | 0.33% | 3.28% |
| 1982 | 0.37% | 3.26% |
| 1981 | 0.34% | 3.11% |
| 1980 | 0.32% | 3.04% |
| 1979 | 0.34% | 3.04% |
| 1978 | 0.38% | 3.07% |
| 1977 | 0.42% | 3.08% |
| 1976 | 0.47% | 3.08% |
| 1975 | 0.55% | 3.04% |
| 1974 | 0.62% | 2.98% |
| 1973 | 0.7% | 2.92% |
| 1972 | 0.77% | 2.85% |
| 1971 | 0.7% | 2.8% |
| 1970 | 0.73% | 2.97% |
| 1969 | 0.82% | 3.24% |
| 1968 | 0.84% | 3.28% |
| 1967 | 0.84% | 3.26% |
| 1966 | 0.8% | 3.25% |
| 1965 | 0.78% | 3.22% |
| 1964 | 0.76% | 3.21% |
| 1963 | 0.76% | 3.21% |
| 1962 | 0.81% | 3.2% |
| 1961 | 0.8% | 3.18% |
Data sources: United Nations | World Population Prospects (2026–2100, retrieved 2026-07-08); World Bank | Health (1961–2025, retrieved 2026-07-08).
GeoRank.org/population/norway/zambia | CC BY
In 2025, the population of Norway grew by 0.69%, while Zambia's population grew by 2.81%.
Live population counters
|
Norway
|
Zambia
|
|
|---|---|---|
| Current population |
5660666
|
22844606
|
| Population rank | 119/197 | 62/197 |
| Percent of world population | 0.07% | 0.27% |
| One net population change |
13.7 minutes
|
52.8 seconds
|
| One birth every |
9.72 minutes
|
45.2 seconds
|
| One death every |
11.9 minutes
|
4.77 minutes
|
| Daily growth/decline | +106 | +1,641 |
| Annual growth/decline | +38,591 | +598,918 |
| Annual growth/decline rate | +0.69% | +2.81% |
| Population growth rate rank | 117/197 | 19/197 |
| One migration net change every |
17.7 minutes
|
1.34 hours
|
| Annual migration change | +29,798 | +6,562 |
| Net migration rank | 29/196 | 47/196 |
| Foreign-born residents | 1,012,404 | 249,205 |
| Foreign-born residents rank | 60/195 | 105/195 |
| Foreign-born share of population | 18.2% | 1.2% |
| Foreign-born share rank | 33/195 | 150/195 |
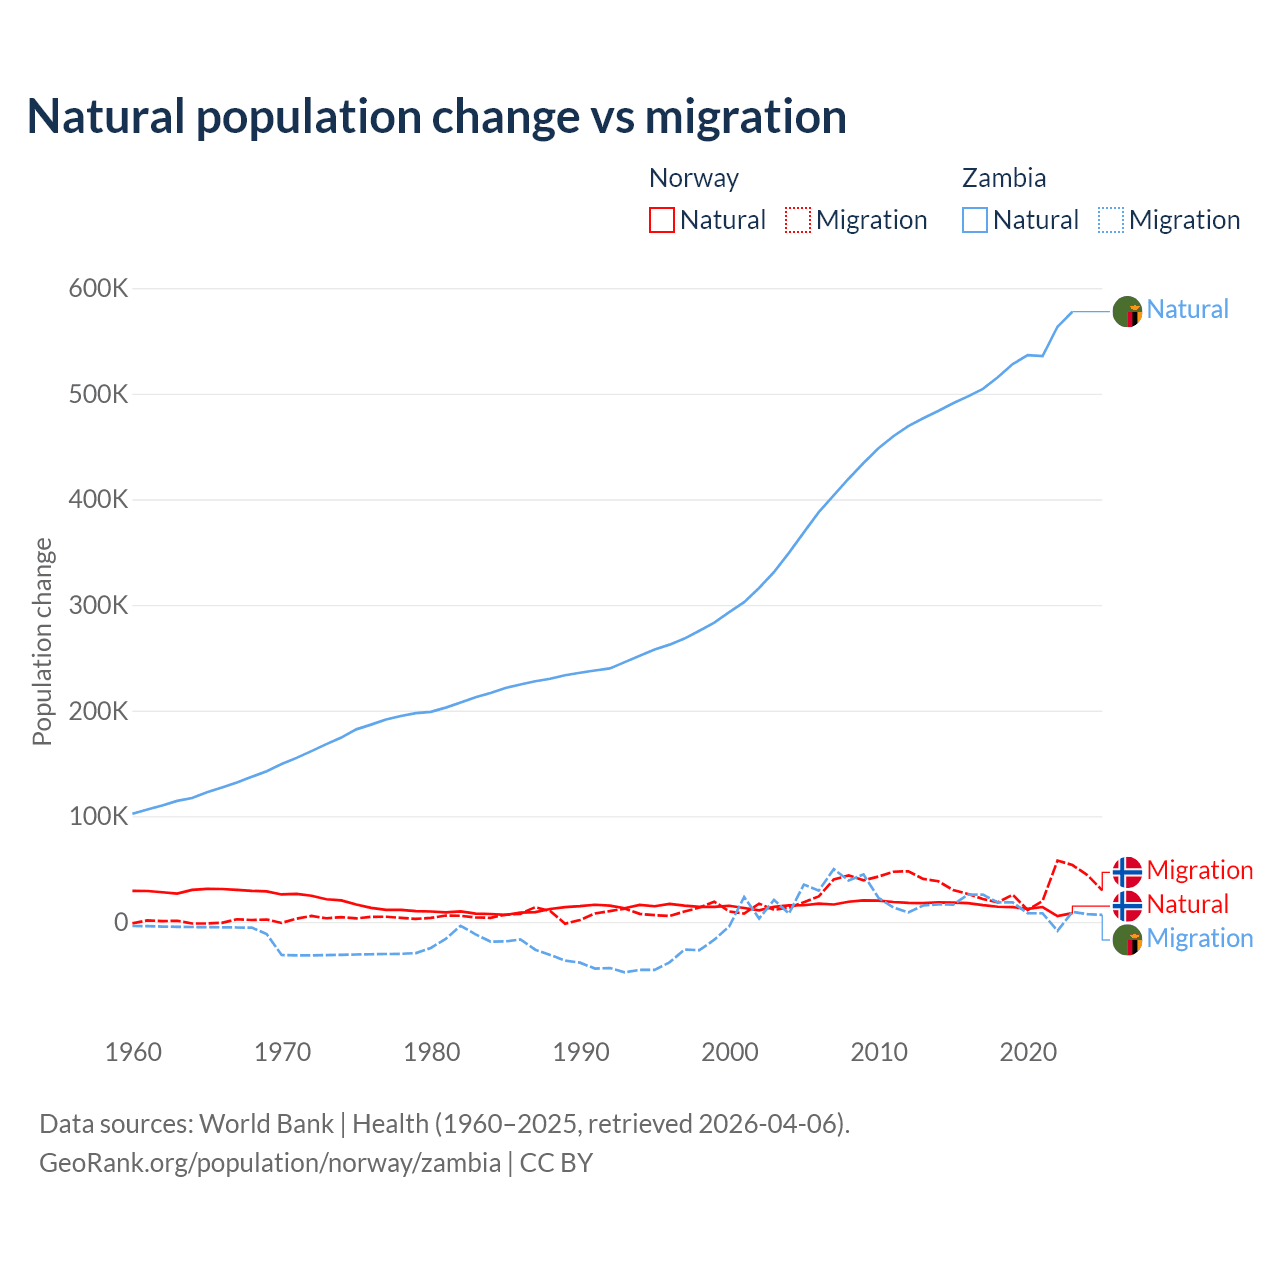
Natural population change vs migration
| Year | Population change | |||
|---|---|---|---|---|
|
Norway
|
Zambia
|
|||
| Natural | Migration | Natural | Migration | |
| 2025 | - | 29,798 | - | 6,562 |
| 2024 | 10,030 | 44,356 | 587,419 | 7,381 |
| 2023 | 8,280 | 53,806 | 577,660 | 9,521 |
| 2022 | 5,457 | 58,040 | 563,456 | -8,566 |
| 2021 | 14,062 | 19,804 | 535,629 | 8,143 |
| 2020 | 12,372 | 11,277 | 536,484 | 8,156 |
| 2019 | 13,904 | 25,707 | 528,089 | 18,385 |
| 2018 | 14,342 | 18,473 | 515,644 | 18,431 |
| 2017 | 15,831 | 21,657 | 504,630 | 25,789 |
| 2016 | 17,797 | 26,417 | 497,521 | 25,860 |
| 2015 | 18,160 | 30,242 | 491,021 | 16,261 |
| 2014 | 18,494 | 38,522 | 483,663 | 16,574 |
| 2013 | 17,779 | 40,690 | 476,846 | 15,542 |
| 2012 | 18,066 | 47,883 | 469,406 | 8,958 |
| 2011 | 18,822 | 47,454 | 459,743 | 13,569 |
| 2010 | 20,046 | 42,865 | 448,337 | 22,761 |
| 2009 | 20,280 | 39,316 | 434,458 | 44,867 |
| 2008 | 19,073 | 44,002 | 419,560 | 39,249 |
| 2007 | 16,482 | 40,111 | 403,729 | 49,945 |
| 2006 | 17,244 | 24,054 | 387,891 | 29,517 |
| 2005 | 15,719 | 18,588 | 368,756 | 35,316 |
| 2004 | 15,612 | 13,412 | 349,352 | 7,819 |
| 2003 | 14,151 | 11,389 | 331,189 | 20,845 |
| 2002 | 10,892 | 17,279 | 316,041 | 3,206 |
| 2001 | 13,090 | 7,906 | 302,682 | 23,582 |
| 2000 | 15,269 | 9,805 | 293,186 | -4,338 |
| 1999 | 14,278 | 19,147 | 283,297 | -16,888 |
| 1998 | 14,181 | 13,519 | 275,568 | -26,796 |
| 1997 | 15,418 | 9,744 | 268,198 | -26,276 |
| 1996 | 17,087 | 5,671 | 262,468 | -38,358 |
| 1995 | 14,821 | 6,343 | 257,897 | -45,423 |
| 1994 | 16,045 | 7,580 | 252,023 | -45,504 |
| 1993 | 12,936 | 12,567 | 245,917 | -47,739 |
| 1992 | 15,431 | 10,218 | 239,953 | -43,656 |
| 1991 | 16,194 | 7,949 | 237,957 | -44,203 |
| 1990 | 14,845 | 1,818 | 235,835 | -38,619 |
| 1989 | 13,949 | -1,730 | 233,429 | -36,736 |
| 1988 | 12,207 | 10,380 | 230,118 | -31,270 |
| 1987 | 9,212 | 13,907 | 227,813 | -26,338 |
| 1986 | 8,751 | 7,616 | 224,768 | -16,610 |
| 1985 | 6,644 | 6,725 | 221,351 | -18,474 |
| 1984 | 7,452 | 3,856 | 216,695 | -18,652 |
| 1983 | 7,844 | 4,120 | 212,712 | -11,849 |
| 1982 | 9,875 | 5,749 | 207,621 | -3,676 |
| 1981 | 9,020 | 6,010 | 202,822 | -16,072 |
| 1980 | 9,806 | 3,763 | 198,817 | -24,664 |
| 1979 | 10,181 | 2,839 | 197,578 | -29,515 |
| 1978 | 11,364 | 3,823 | 194,933 | -30,284 |
| 1977 | 11,321 | 4,845 | 191,557 | -30,423 |
| 1976 | 13,286 | 4,779 | 186,762 | -30,612 |
| 1975 | 16,430 | 3,312 | 182,258 | -30,886 |
| 1974 | 20,324 | 4,425 | 174,484 | -31,178 |
| 1973 | 21,387 | 3,414 | 168,258 | -31,472 |
| 1972 | 24,777 | 5,603 | 161,648 | -31,672 |
| 1971 | 26,541 | 3,031 | 155,249 | -31,651 |
| 1970 | 25,968 | -1,034 | 149,380 | -31,370 |
| 1969 | 28,858 | 2,230 | 142,660 | -11,469 |
| 1968 | 29,387 | 1,761 | 137,315 | -5,447 |
| 1967 | 30,276 | 2,460 | 131,938 | -5,298 |
| 1966 | 31,150 | -888 | 127,164 | -5,129 |
| 1965 | 31,275 | -1,525 | 122,814 | -5,023 |
| 1964 | 30,293 | -1,571 | 117,197 | -4,851 |
| 1963 | 26,766 | 1,061 | 114,555 | -4,676 |
| 1962 | 28,020 | 655 | 110,173 | -4,428 |
| 1961 | 29,239 | 1,437 | 106,318 | -4,043 |
| 1960 | 29,366 | -1,427 | 102,335 | -3,898 |
Data sources: World Bank | Health (1960–2025, retrieved 2026-07-08).
GeoRank.org/population/norway/zambia | CC BY
Over the last 10 years, 29.6% of the population change in Norway is from natural causes (a gain of 130,235 people) and 70.4% is from migration (a gain of 309,779 people). In Zambia 97.6% is from natural causes (a gain of 5,337,553 people) and 2.37% is from migration (a gain of 129,361 people).
As of 2024, 1,012,404 residents or 18.2% of the population were not native-born in Norway, compared to 249,205 people or 1.2% in Zambia.
Biggest cities by population
|
Norway
|
|
|---|---|
| City | Population |
| Oslo | 718K |
| Bergen | 291K |
| Trondheim | 199K |
| Stavanger | 152K |
| Baerum | 133K |
| Drammen | 106K |
| Asker | 102K |
| Lillestrom | 96.8K |
| Fredrikstad | 86.2K |
| Sandnes | 85.8K |
|
Zambia
|
|
|---|---|
| City | Population |
| Lusaka | 2.47M |
| Kitwe | 625K |
| Ndola | 528K |
| Chingola | 255K |
| Mufulira | 182K |
| Livingstone | 177K |
| Kasama | 158K |
| Kapiri Mposhi | 65.2K |
| Choma | 51.8K |
| Mansa | 45.4K |
Compare countries by 7 more topics
Population differences between Norway and Zambia
|
Norway
|
Zambia
|
|
|---|---|---|
| Life expectancy | 83.8 years | 66.9 years |
| Average age | 41.5 years | 22.8 years |
| Median age | 40.9 years | 19 years |
| Male:Female ratio | 50.4:49.6 | 49.5:50.5 |
| Fertility rate | 1.45 births per woman | 4.04 births per woman |
| Population density | 40.2 ppl/mi² | 78.5 ppl/mi² |
Population map with other countries
Data sources: World Bank | Health (1960–2025, retrieved 2026-07-08); United Nations | World Population Prospects (1960–2026, retrieved 2026-07-08); U.S. Census Bureau (1960–2025, retrieved 2026-07-08); Central Intelligence Agency (CIA) (2000–2019, retrieved 2026-07-08).
GeoRank.org/population/norway/zambia | CC BY
Help us show the world through your eyes
Share a photo of your city and help others discover what it looks like to live there. Your contribution makes our data come alive.
Data sources:
- World Bank | Health (1960–2025, retrieved 2026-07-08)
- United Nations | World Population Prospects (1960–2100, retrieved 2026-07-08)
- U.S. Census Bureau (1960–2025, retrieved 2026-07-08)
- Wikidata (2026, retrieved 2026-07-08)
- Central Intelligence Agency (CIA) (2000–2019, retrieved 2026-07-08)
Creative Commons Attribution (CC BY) — you’re free to copy, share, remix, adapt, and use even commercially as long as you give appropriate credit and clearly indicate if you made changes. Other sources may be subject to different license terms.