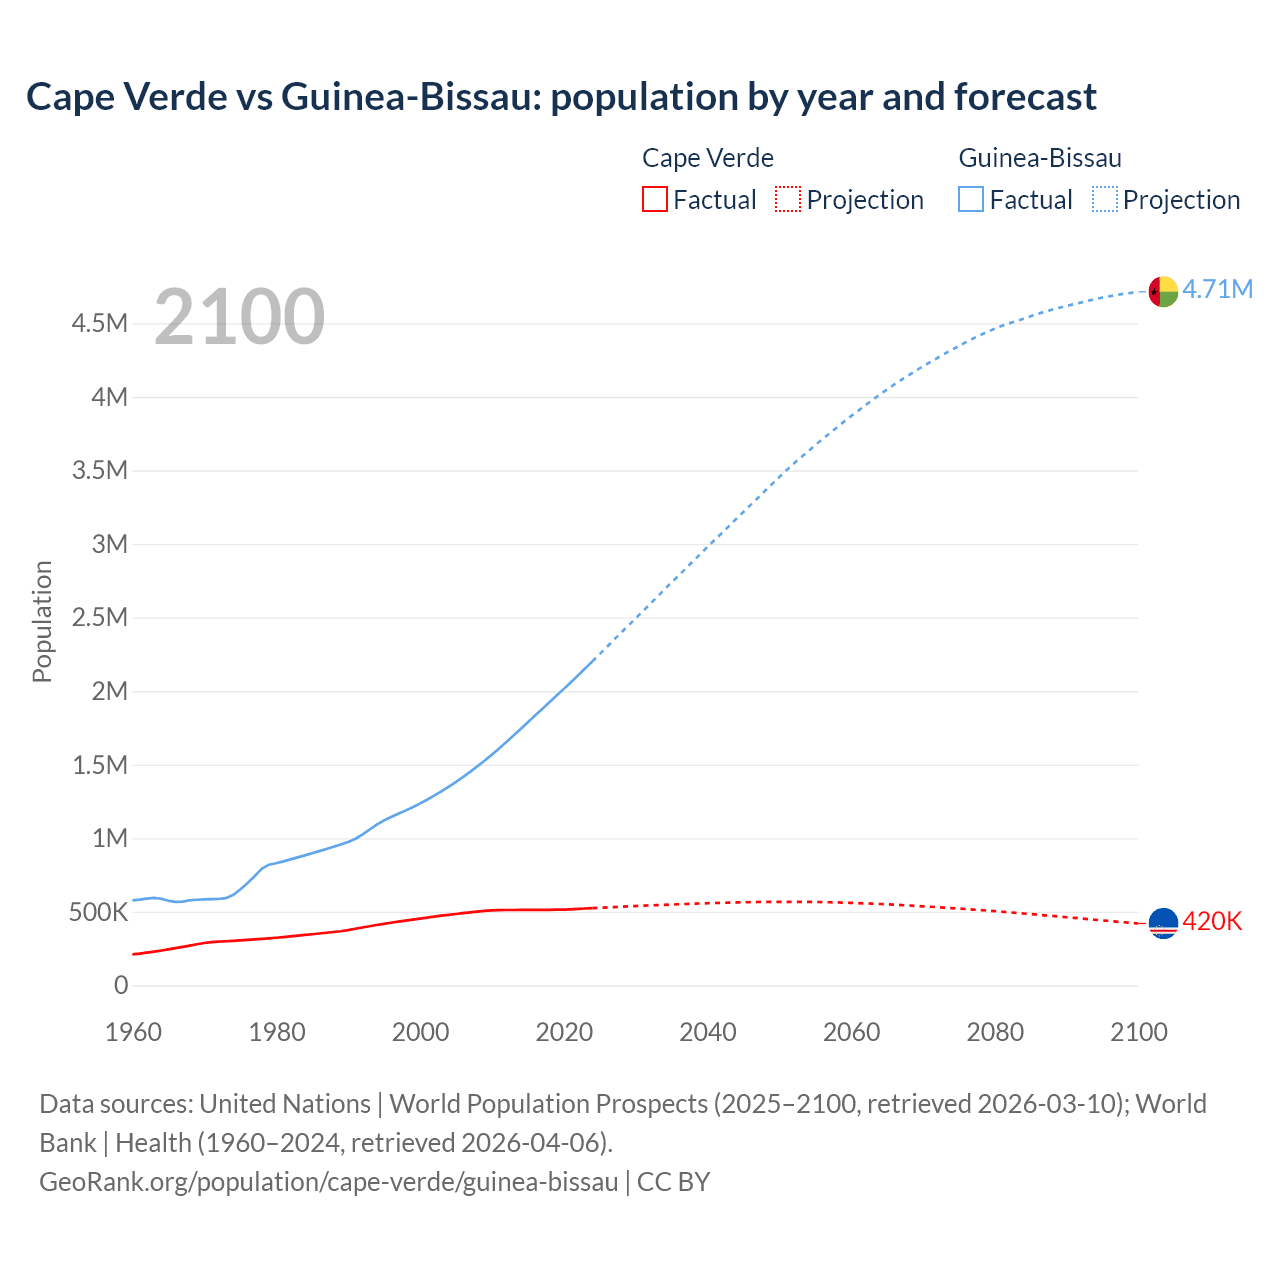
The latest officially reported population of Cape Verde was 527,326 in 2025 vs 2,249,515 people in Guinea-Bissau in 2025. In 2026, based on the adjusted UN estimation, the current Cape Verde's population is 530,853 people compared to 2,323,460 in Guinea-Bissau.
Population statistics:
- Guinea-Bissau's population is 4.38 times bigger than Cape Verde's.
- Cape Verde is ranked the 169th most populous country in the world, while Guinea-Bissau is the 146th.
- The countries together account for 0.03% of the world: 0.006% for Cape Verde vs 0.03% for Guinea-Bissau.
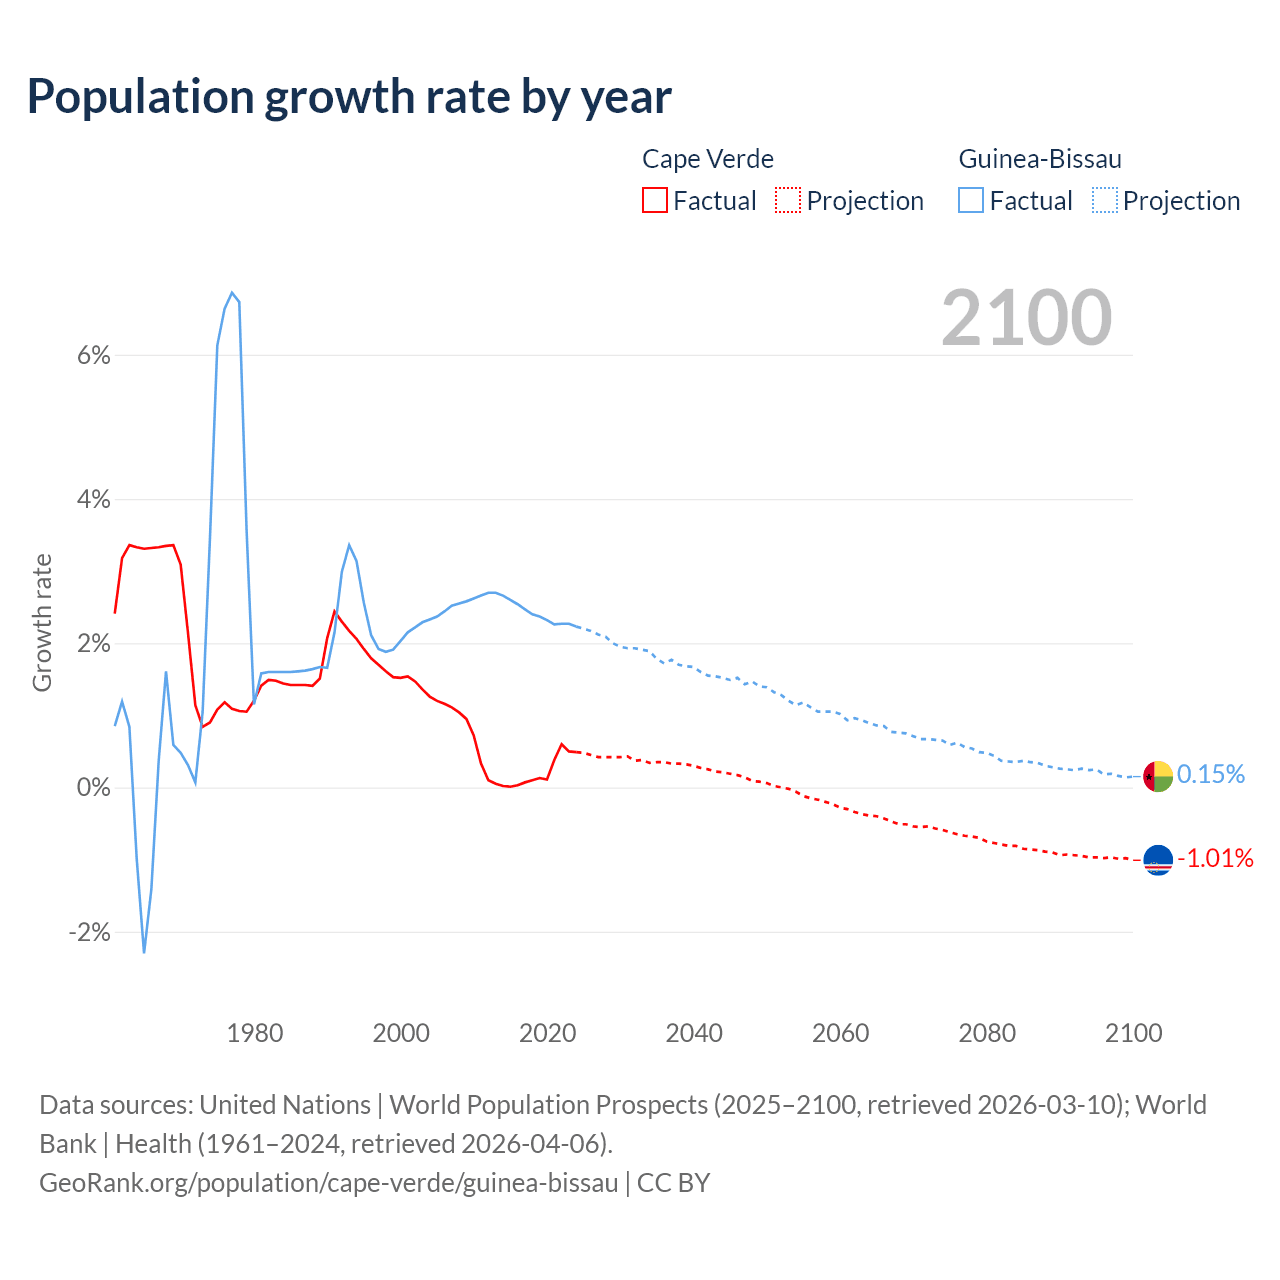
- For the last 10 years, Cape Verde has had an average growth rate of +0.26% per year vs +2.36% in Guinea-Bissau.
- Since 2006, the population of Cape Verde has increased from 491K people to 531K (8.18% growth), while Guinea-Bissau has grown from 1.42M to 2.32M (64.2% growth).
Cape Verde vs Guinea-Bissau: population by year and forecast
| Year | Population | |
|---|---|---|
 Cape Verde
|
 Guinea-Bissau
|
|
| 2100 | 419,997 | 4,713,104 |
| 2099 | 424,272 | 4,706,098 |
| 2098 | 428,479 | 4,699,568 |
| 2097 | 432,755 | 4,691,855 |
| 2096 | 437,010 | 4,682,938 |
| 2095 | 441,329 | 4,674,608 |
| 2094 | 445,663 | 4,663,103 |
| 2093 | 450,029 | 4,651,788 |
| 2092 | 454,324 | 4,639,582 |
| 2091 | 458,616 | 4,628,423 |
| 2090 | 462,925 | 4,616,772 |
| 2089 | 467,304 | 4,604,837 |
| 2088 | 471,550 | 4,592,099 |
| 2087 | 475,770 | 4,578,407 |
| 2086 | 479,948 | 4,562,793 |
| 2085 | 484,130 | 4,547,020 |
| 2084 | 488,284 | 4,530,206 |
| 2083 | 492,265 | 4,514,557 |
| 2082 | 496,287 | 4,498,172 |
| 2081 | 500,248 | 4,481,590 |
| 2080 | 504,114 | 4,461,992 |
| 2079 | 507,910 | 4,440,836 |
| 2078 | 511,491 | 4,419,277 |
| 2077 | 514,982 | 4,395,599 |
| 2076 | 518,448 | 4,371,019 |
| 2075 | 521,841 | 4,343,934 |
| 2074 | 525,092 | 4,318,519 |
| 2073 | 528,231 | 4,290,772 |
| 2072 | 531,275 | 4,262,846 |
| 2071 | 534,138 | 4,234,576 |
| 2070 | 537,082 | 4,206,253 |
| 2069 | 539,993 | 4,176,501 |
| 2068 | 542,768 | 4,145,457 |
| 2067 | 545,560 | 4,114,243 |
| 2066 | 548,154 | 4,082,951 |
| 2065 | 550,545 | 4,048,502 |
| 2064 | 552,744 | 4,013,784 |
| 2063 | 554,888 | 3,978,328 |
| 2062 | 556,973 | 3,941,631 |
| 2061 | 558,855 | 3,904,197 |
| 2060 | 560,518 | 3,868,146 |
| 2059 | 562,114 | 3,829,277 |
| 2058 | 563,436 | 3,789,609 |
| 2057 | 564,587 | 3,750,140 |
| 2056 | 565,521 | 3,710,996 |
| 2055 | 566,347 | 3,670,229 |
| 2054 | 567,010 | 3,627,303 |
| 2053 | 567,363 | 3,586,333 |
| 2052 | 567,478 | 3,543,640 |
| 2051 | 567,476 | 3,498,845 |
| 2050 | 567,344 | 3,453,155 |
| 2049 | 567,002 | 3,405,764 |
| 2048 | 566,562 | 3,358,731 |
| 2047 | 566,027 | 3,310,142 |
| 2046 | 565,225 | 3,263,507 |
| 2045 | 564,268 | 3,214,677 |
| 2044 | 563,194 | 3,167,400 |
| 2043 | 562,030 | 3,120,097 |
| 2042 | 560,769 | 3,072,862 |
| 2041 | 559,386 | 3,025,833 |
| 2040 | 557,874 | 2,978,159 |
| 2039 | 556,224 | 2,929,364 |
| 2038 | 554,435 | 2,881,007 |
| 2037 | 552,627 | 2,832,794 |
| 2036 | 550,801 | 2,783,401 |
| 2035 | 548,853 | 2,736,240 |
| 2034 | 546,915 | 2,688,290 |
| 2033 | 545,056 | 2,638,427 |
| 2032 | 542,980 | 2,588,961 |
| 2031 | 540,984 | 2,540,013 |
| 2030 | 538,671 | 2,491,987 |
| 2029 | 536,441 | 2,444,278 |
| 2028 | 534,196 | 2,396,253 |
| 2027 | 531,944 | 2,347,151 |
| 2026 | 529,702 | 2,298,439 |
| 2025 | 527,326 | 2,249,515 |
| 2024 | 524,877 | 2,201,352 |
| 2023 | 522,331 | 2,153,339 |
| 2022 | 519,741 | 2,105,529 |
| 2021 | 516,649 | 2,058,841 |
| 2020 | 514,679 | 2,013,255 |
| 2019 | 514,104 | 1,967,696 |
| 2018 | 513,415 | 1,922,168 |
| 2017 | 512,893 | 1,877,072 |
| 2016 | 512,554 | 1,831,893 |
| 2015 | 512,394 | 1,786,457 |
| 2014 | 512,326 | 1,741,122 |
| 2013 | 512,225 | 1,695,973 |
| 2012 | 511,955 | 1,651,417 |
| 2011 | 511,447 | 1,608,076 |
| 2010 | 509,784 | 1,566,347 |
| 2009 | 506,141 | 1,526,377 |
| 2008 | 501,355 | 1,488,054 |
| 2007 | 496,190 | 1,450,986 |
| 2006 | 490,728 | 1,415,303 |
| 2005 | 485,115 | 1,381,585 |
| 2004 | 479,370 | 1,349,563 |
| 2003 | 473,383 | 1,318,806 |
| 2002 | 467,046 | 1,289,307 |
| 2001 | 460,293 | 1,261,273 |
| 2000 | 453,317 | 1,234,741 |
| 1999 | 446,519 | 1,210,206 |
| 1998 | 439,784 | 1,187,473 |
| 1997 | 432,798 | 1,165,545 |
| 1996 | 425,581 | 1,143,535 |
| 1995 | 418,104 | 1,119,949 |
| 1994 | 410,228 | 1,092,031 |
| 1993 | 401,965 | 1,058,745 |
| 1992 | 393,415 | 1,024,356 |
| 1991 | 384,586 | 994,639 |
| 1990 | 375,428 | 973,669 |
| 1989 | 367,803 | 957,789 |
| 1988 | 362,329 | 942,061 |
| 1987 | 357,302 | 926,862 |
| 1986 | 352,312 | 912,126 |
| 1985 | 347,365 | 897,697 |
| 1984 | 342,505 | 883,519 |
| 1983 | 337,654 | 869,592 |
| 1982 | 332,724 | 855,891 |
| 1981 | 327,846 | 842,432 |
| 1980 | 323,301 | 829,303 |
| 1979 | 319,480 | 819,867 |
| 1978 | 316,147 | 791,694 |
| 1977 | 312,834 | 741,789 |
| 1976 | 309,455 | 694,191 |
| 1975 | 305,847 | 650,966 |
| 1974 | 302,570 | 613,338 |
| 1973 | 299,881 | 592,808 |
| 1972 | 297,386 | 586,620 |
| 1971 | 294,046 | 586,221 |
| 1970 | 287,885 | 584,403 |
| 1969 | 279,248 | 581,610 |
| 1968 | 270,164 | 578,170 |
| 1967 | 261,404 | 569,011 |
| 1966 | 252,976 | 566,908 |
| 1965 | 244,856 | 575,005 |
| 1964 | 237,006 | 588,543 |
| 1963 | 229,373 | 594,418 |
| 1962 | 221,919 | 589,474 |
| 1961 | 215,087 | 582,532 |
| 1960 | 210,024 | 577,633 |
Data sources: United Nations | World Population Prospects (2026–2100, retrieved 2026-07-08); World Bank | Health (1960–2025, retrieved 2026-07-08).
GeoRank.org/population/cape-verde/guinea-bissau | CC BY 
From 2006 to 2016, the population of Cape Verde increased by 21,826 people (a 4.45% growth), while Guinea-Bissau gained 416,590 people (a 29.4% growth).
For the next 10 years, from 2016 to 2026, Cape Verde gained 18,299 people (a 3.57% growth), while Guinea-Bissau's population increased by 491,567 people (a 26.8% growth).
Cape Verde was ranked 166th most populous country in 2006 and is 169th in 2026. Guinea-Bissau was ranked 148th in 2006 and ranked 146th now.
The UN's World Population Prospects forecasts that in 24 years (in 2050) Cape Verde's population will grow by 6.87% to 567,344 people with a rank change from 169th to 168th. The population of Guinea-Bissau will increase by 48.6% to 3,453,155 people and rank change from 146th to 136th.
Cape Verde is projected to reach its peak in 2052 at 567K people compared to the peak of 4.71M people in 2100 for Guinea-Bissau.
Population growth rate by year
| Year | Growth rate | |
|---|---|---|
|
Cape Verde
|
Guinea-Bissau
|
|
| 2100 | -1.01% | 0.15% |
| 2099 | -0.98% | 0.14% |
| 2098 | -0.99% | 0.16% |
| 2097 | -0.97% | 0.19% |
| 2096 | -0.98% | 0.18% |
| 2095 | -0.97% | 0.25% |
| 2094 | -0.97% | 0.24% |
| 2093 | -0.95% | 0.26% |
| 2092 | -0.94% | 0.24% |
| 2091 | -0.93% | 0.25% |
| 2090 | -0.94% | 0.26% |
| 2089 | -0.9% | 0.28% |
| 2088 | -0.89% | 0.3% |
| 2087 | -0.87% | 0.34% |
| 2086 | -0.86% | 0.35% |
| 2085 | -0.85% | 0.37% |
| 2084 | -0.81% | 0.35% |
| 2083 | -0.81% | 0.36% |
| 2082 | -0.79% | 0.37% |
| 2081 | -0.77% | 0.44% |
| 2080 | -0.75% | 0.48% |
| 2079 | -0.7% | 0.49% |
| 2078 | -0.68% | 0.54% |
| 2077 | -0.67% | 0.56% |
| 2076 | -0.65% | 0.62% |
| 2075 | -0.62% | 0.59% |
| 2074 | -0.59% | 0.65% |
| 2073 | -0.57% | 0.66% |
| 2072 | -0.54% | 0.67% |
| 2071 | -0.55% | 0.67% |
| 2070 | -0.54% | 0.71% |
| 2069 | -0.51% | 0.75% |
| 2068 | -0.51% | 0.76% |
| 2067 | -0.47% | 0.77% |
| 2066 | -0.43% | 0.85% |
| 2065 | -0.4% | 0.86% |
| 2064 | -0.39% | 0.89% |
| 2063 | -0.37% | 0.93% |
| 2062 | -0.34% | 0.96% |
| 2061 | -0.3% | 0.93% |
| 2060 | -0.28% | 1.02% |
| 2059 | -0.23% | 1.05% |
| 2058 | -0.2% | 1.05% |
| 2057 | -0.17% | 1.05% |
| 2056 | -0.15% | 1.11% |
| 2055 | -0.12% | 1.18% |
| 2054 | -0.06% | 1.14% |
| 2053 | -0.02% | 1.2% |
| 2052 | 0% | 1.28% |
| 2051 | 0.02% | 1.32% |
| 2050 | 0.06% | 1.39% |
| 2049 | 0.08% | 1.4% |
| 2048 | 0.09% | 1.47% |
| 2047 | 0.14% | 1.43% |
| 2046 | 0.17% | 1.52% |
| 2045 | 0.19% | 1.49% |
| 2044 | 0.21% | 1.52% |
| 2043 | 0.22% | 1.54% |
| 2042 | 0.25% | 1.55% |
| 2041 | 0.27% | 1.6% |
| 2040 | 0.3% | 1.67% |
| 2039 | 0.32% | 1.68% |
| 2038 | 0.33% | 1.7% |
| 2037 | 0.33% | 1.77% |
| 2036 | 0.35% | 1.72% |
| 2035 | 0.35% | 1.78% |
| 2034 | 0.34% | 1.89% |
| 2033 | 0.38% | 1.91% |
| 2032 | 0.37% | 1.93% |
| 2031 | 0.43% | 1.93% |
| 2030 | 0.42% | 1.95% |
| 2029 | 0.42% | 2% |
| 2028 | 0.42% | 2.09% |
| 2027 | 0.42% | 2.12% |
| 2026 | 0.45% | 2.17% |
| 2025 | 0.47% | 2.19% |
| 2024 | 0.49% | 2.23% |
| 2023 | 0.5% | 2.27% |
| 2022 | 0.6% | 2.27% |
| 2021 | 0.38% | 2.26% |
| 2020 | 0.11% | 2.32% |
| 2019 | 0.13% | 2.37% |
| 2018 | 0.1% | 2.4% |
| 2017 | 0.07% | 2.47% |
| 2016 | 0.03% | 2.54% |
| 2015 | 0.01% | 2.6% |
| 2014 | 0.02% | 2.66% |
| 2013 | 0.05% | 2.7% |
| 2012 | 0.1% | 2.7% |
| 2011 | 0.33% | 2.66% |
| 2010 | 0.72% | 2.62% |
| 2009 | 0.95% | 2.58% |
| 2008 | 1.04% | 2.55% |
| 2007 | 1.11% | 2.52% |
| 2006 | 1.16% | 2.44% |
| 2005 | 1.2% | 2.37% |
| 2004 | 1.26% | 2.33% |
| 2003 | 1.36% | 2.29% |
| 2002 | 1.47% | 2.22% |
| 2001 | 1.54% | 2.15% |
| 2000 | 1.52% | 2.03% |
| 1999 | 1.53% | 1.91% |
| 1998 | 1.61% | 1.88% |
| 1997 | 1.7% | 1.92% |
| 1996 | 1.79% | 2.11% |
| 1995 | 1.92% | 2.56% |
| 1994 | 2.06% | 3.14% |
| 1993 | 2.17% | 3.36% |
| 1992 | 2.3% | 2.99% |
| 1991 | 2.44% | 2.15% |
| 1990 | 2.07% | 1.66% |
| 1989 | 1.51% | 1.67% |
| 1988 | 1.41% | 1.64% |
| 1987 | 1.42% | 1.62% |
| 1986 | 1.42% | 1.61% |
| 1985 | 1.42% | 1.6% |
| 1984 | 1.44% | 1.6% |
| 1983 | 1.48% | 1.6% |
| 1982 | 1.49% | 1.6% |
| 1981 | 1.41% | 1.58% |
| 1980 | 1.2% | 1.15% |
| 1979 | 1.05% | 3.56% |
| 1978 | 1.06% | 6.73% |
| 1977 | 1.09% | 6.86% |
| 1976 | 1.18% | 6.64% |
| 1975 | 1.08% | 6.13% |
| 1974 | 0.9% | 3.46% |
| 1973 | 0.84% | 1.05% |
| 1972 | 1.14% | 0.07% |
| 1971 | 2.14% | 0.31% |
| 1970 | 3.09% | 0.48% |
| 1969 | 3.36% | 0.59% |
| 1968 | 3.35% | 1.61% |
| 1967 | 3.33% | 0.37% |
| 1966 | 3.32% | -1.41% |
| 1965 | 3.31% | -2.3% |
| 1964 | 3.33% | -0.99% |
| 1963 | 3.36% | 0.84% |
| 1962 | 3.18% | 1.19% |
| 1961 | 2.41% | 0.85% |
Data sources: United Nations | World Population Prospects (2026–2100, retrieved 2026-07-08); World Bank | Health (1961–2025, retrieved 2026-07-08).
GeoRank.org/population/cape-verde/guinea-bissau | CC BY
In 2025, the population of Cape Verde grew by 0.47%, while Guinea-Bissau's population grew by 2.19%.
Live population counters
|
Cape Verde
|
Guinea-Bissau
|
|
|---|---|---|
| Current population |
530853
|
2323460
|
| Population rank | 169/197 | 146/197 |
| Percent of world population | 0.006% | 0.03% |
| One net population change |
3.59 hours
|
10.9 minutes
|
| One birth every |
1.37 hours
|
8.08 minutes
|
| One death every |
3.28 hours
|
34.1 minutes
|
| Daily growth/decline | +7 | +132 |
| Annual growth/decline | +2,449 | +48,163 |
| Annual growth/decline rate | +0.47% | +2.19% |
| Population growth rate rank | 132/197 | 41/197 |
| One migration net change every |
6.84 hours
|
6.4 hours
|
| Annual migration change | -1,284 | -1,373 |
| Net migration rank | 94/196 | 96/196 |
| Foreign-born residents | 16,515 | 15,064 |
| Foreign-born residents rank | 171/195 | 172/195 |
| Foreign-born share of population | 3.1% | 0.7% |
| Foreign-born share rank | 116/195 | 165/195 |
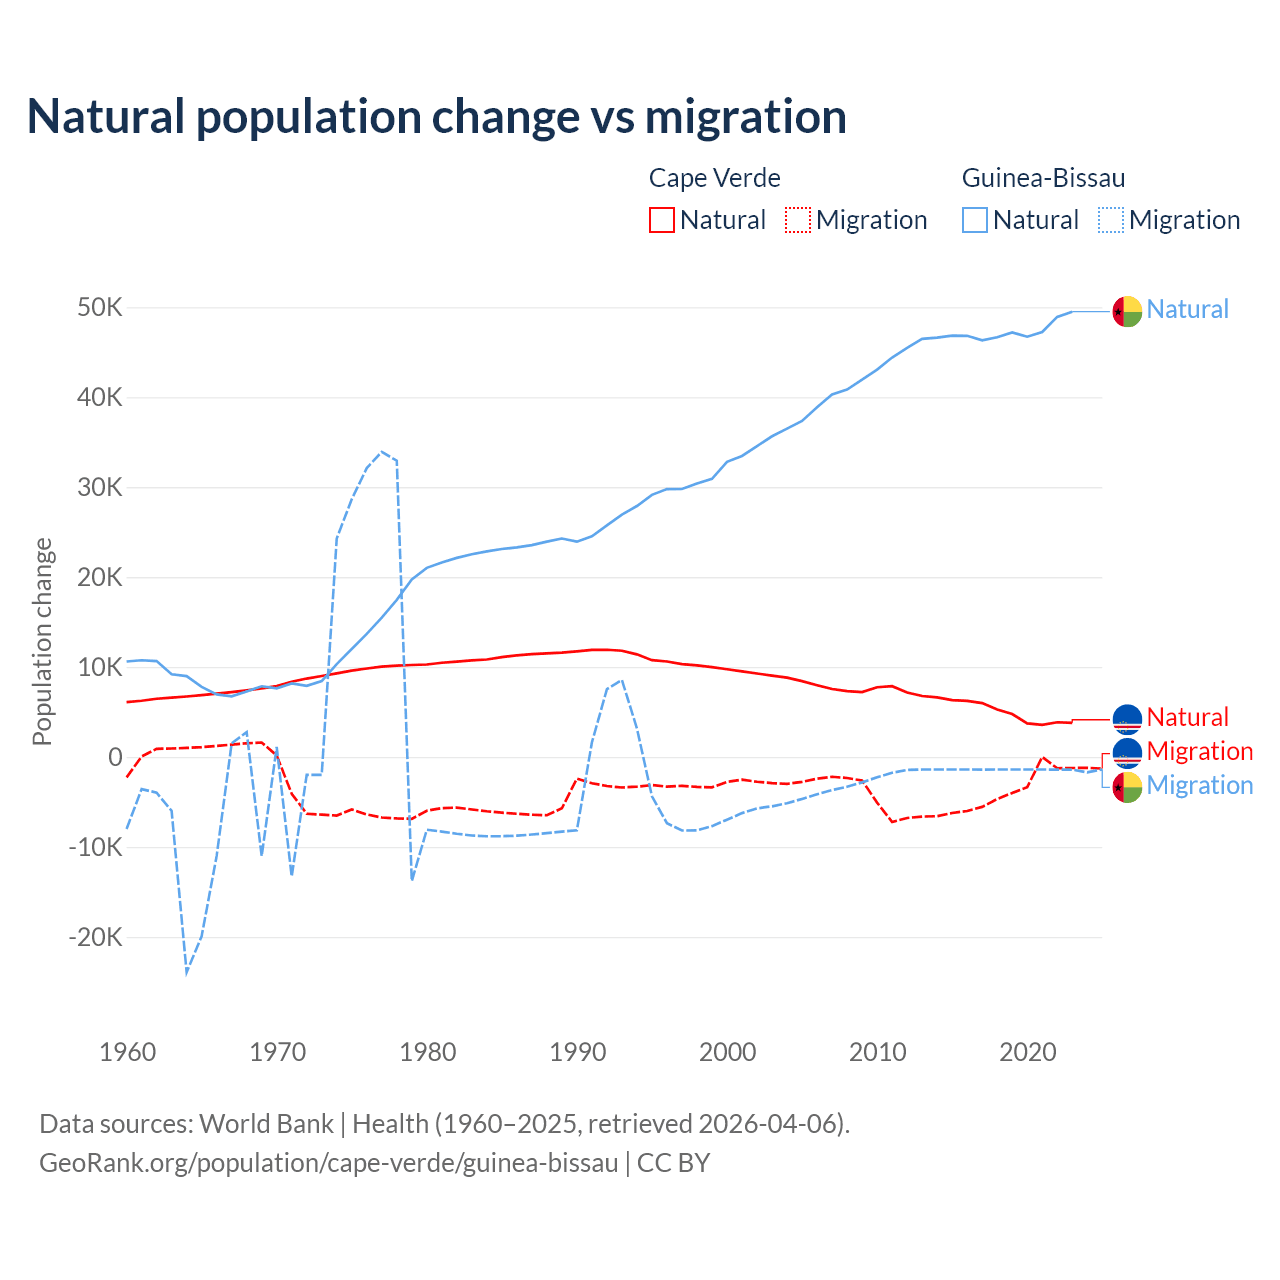
Natural population change vs migration
| Year | Population change | |||
|---|---|---|---|---|
|
Cape Verde
|
Guinea-Bissau
|
|||
| Natural | Migration | Natural | Migration | |
| 2025 | - | -1,284 | - | -1,373 |
| 2024 | 3,741 | -1,209 | 49,642 | -1,712 |
| 2023 | 3,798 | -1,226 | 49,498 | -1,400 |
| 2022 | 3,864 | -1,253 | 48,920 | -1,400 |
| 2021 | 3,575 | 0 | 47,242 | -1,395 |
| 2020 | 3,734 | -3,362 | 46,718 | -1,394 |
| 2019 | 4,773 | -4,001 | 47,196 | -1,395 |
| 2018 | 5,282 | -4,679 | 46,659 | -1,396 |
| 2017 | 5,993 | -5,550 | 46,318 | -1,398 |
| 2016 | 6,238 | -6,004 | 46,814 | -1,392 |
| 2015 | 6,314 | -6,226 | 46,846 | -1,393 |
| 2014 | 6,622 | -6,578 | 46,615 | -1,393 |
| 2013 | 6,780 | -6,622 | 46,472 | -1,395 |
| 2012 | 7,157 | -6,779 | 45,480 | -1,442 |
| 2011 | 7,874 | -7,226 | 44,405 | -1,760 |
| 2010 | 7,746 | -5,069 | 43,067 | -2,257 |
| 2009 | 7,216 | -2,618 | 41,950 | -2,821 |
| 2008 | 7,313 | -2,340 | 40,841 | -3,313 |
| 2007 | 7,559 | -2,200 | 40,288 | -3,676 |
| 2006 | 7,980 | -2,408 | 38,886 | -4,142 |
| 2005 | 8,428 | -2,768 | 37,347 | -4,662 |
| 2004 | 8,825 | -2,993 | 36,495 | -5,144 |
| 2003 | 9,037 | -2,898 | 35,649 | -5,487 |
| 2002 | 9,278 | -2,751 | 34,561 | -5,712 |
| 2001 | 9,510 | -2,528 | 33,461 | -6,239 |
| 2000 | 9,752 | -2,772 | 32,816 | -6,971 |
| 1999 | 9,989 | -3,371 | 30,916 | -7,686 |
| 1998 | 10,187 | -3,332 | 30,390 | -8,163 |
| 1997 | 10,323 | -3,211 | 29,792 | -8,176 |
| 1996 | 10,613 | -3,297 | 29,778 | -7,369 |
| 1995 | 10,764 | -3,125 | 29,142 | -4,376 |
| 1994 | 11,410 | -3,299 | 27,895 | 3,174 |
| 1993 | 11,805 | -3,393 | 26,943 | 8,562 |
| 1992 | 11,915 | -3,231 | 25,747 | 7,531 |
| 1991 | 11,899 | -2,924 | 24,527 | 1,621 |
| 1990 | 11,738 | -2,398 | 23,936 | -8,151 |
| 1989 | 11,608 | -5,704 | 24,286 | -8,296 |
| 1988 | 11,523 | -6,474 | 23,940 | -8,473 |
| 1987 | 11,426 | -6,418 | 23,549 | -8,622 |
| 1986 | 11,295 | -6,314 | 23,301 | -8,748 |
| 1985 | 11,105 | -6,192 | 23,116 | -8,812 |
| 1984 | 10,835 | -6,035 | 22,861 | -8,812 |
| 1983 | 10,736 | -5,834 | 22,542 | -8,729 |
| 1982 | 10,597 | -5,629 | 22,131 | -8,539 |
| 1981 | 10,470 | -5,684 | 21,611 | -8,291 |
| 1980 | 10,276 | -5,980 | 21,024 | -8,086 |
| 1979 | 10,223 | -6,875 | 19,736 | -13,801 |
| 1978 | 10,152 | -6,833 | 17,468 | 32,936 |
| 1977 | 10,036 | -6,730 | 15,484 | 33,922 |
| 1976 | 9,833 | -6,389 | 13,688 | 32,113 |
| 1975 | 9,601 | -5,829 | 11,998 | 28,645 |
| 1974 | 9,295 | -6,512 | 10,321 | 24,290 |
| 1973 | 9,003 | -6,410 | 8,430 | -1,985 |
| 1972 | 8,716 | -6,316 | 7,911 | -1,985 |
| 1971 | 8,359 | -4,085 | 8,183 | -13,302 |
| 1970 | 7,878 | 172 | 7,632 | 1,123 |
| 1969 | 7,625 | 1,608 | 7,857 | -11,033 |
| 1968 | 7,408 | 1,521 | 7,289 | 2,769 |
| 1967 | 7,214 | 1,376 | 6,742 | 1,516 |
| 1966 | 7,039 | 1,230 | 6,955 | -11,006 |
| 1965 | 6,877 | 1,093 | 7,789 | -19,928 |
| 1964 | 6,725 | 1,006 | 8,989 | -23,936 |
| 1963 | 6,589 | 945 | 9,190 | -5,993 |
| 1962 | 6,468 | 904 | 10,662 | -3,960 |
| 1961 | 6,247 | 49 | 10,756 | -3,575 |
| 1960 | 6,098 | -2,267 | 10,618 | -8,007 |
Data sources: World Bank | Health (1960–2025, retrieved 2026-07-08).
GeoRank.org/population/cape-verde/guinea-bissau | CC BY
Over the last 10 years, 58.5% of the population change in Cape Verde is from natural causes (a gain of 47,312 people) and 41.5% is from migration (a loss of 33,510 people). In Guinea-Bissau 97.1% is from natural causes (a gain of 475,853 people) and 2.91% is from migration (a loss of 14,275 people).
As of 2024, 16,515 residents or 3.1% of the population were not native-born in Cape Verde, compared to 15,064 people or 0.7% in Guinea-Bissau.
Biggest cities by population
|
Cape Verde
|
|
|---|---|
| City | Population |
| Praia | 159K |
| Mindelo | 70.5K |
| Assomada | 12K |
|
Guinea-Bissau
|
|
|---|---|
| City | Population |
| Bissau | 492K |
| Bafata | 29.6K |
Compare countries by 7 more topics
Population differences between Cape Verde and Guinea-Bissau
|
Cape Verde
|
Guinea-Bissau
|
|
|---|---|---|
| Life expectancy | 76.6 years | 64.6 years |
| Average age | 31.9 years | 24.4 years |
| Median age | 30 years | 20.4 years |
| Male:Female ratio | 50.9:49.1 | 49.4:50.6 |
| Fertility rate | 1.51 births per woman | 3.76 births per woman |
| Population density | 340 ppl/mi² | 211.7 ppl/mi² |
Population map with other countries
Data sources: World Bank | Health (1960–2025, retrieved 2026-07-08); United Nations | World Population Prospects (1960–2026, retrieved 2026-07-08); U.S. Census Bureau (1960–2025, retrieved 2026-07-08); Central Intelligence Agency (CIA) (2000–2019, retrieved 2026-07-08).
GeoRank.org/population/cape-verde/guinea-bissau | CC BY
Help us show the world through your eyes
Share a photo of your city and help others discover what it looks like to live there. Your contribution makes our data come alive.
Data sources:
- World Bank | Health (1960–2025, retrieved 2026-07-08)
- United Nations | World Population Prospects (1960–2100, retrieved 2026-07-08)
- U.S. Census Bureau (1960–2025, retrieved 2026-07-08)
- Central Intelligence Agency (CIA) (2000–2019, retrieved 2026-07-08)
- Wikidata (2026, retrieved 2026-07-08)
Creative Commons Attribution (CC BY) — you’re free to copy, share, remix, adapt, and use even commercially as long as you give appropriate credit and clearly indicate if you made changes. Other sources may be subject to different license terms.