The latest officially reported population of Malawi was 22,216,120 in 2025 vs 6,549,143 people in Serbia in 2025. In 2026, based on the adjusted UN estimation, the current Malawi's population is 23,086,106 people compared to 6,500,256 in Serbia.
Population statistics:
- Malawi's population is 3.55 times bigger than Serbia's.
- Malawi is ranked the 61st most populous country in the world, while Serbia is the 110th.
- The countries together account for 0.36% of the world: 0.28% for Malawi vs 0.08% for Serbia.
- For the last 10 years, Malawi has had an average growth rate of +2.67% per year vs -0.77% in Serbia.
- Since 2006, the population of Malawi has increased from 13.2M people to 23.1M (74.9% growth), while Serbia has declined from 7.41M to 6.5M (12.3% decline).
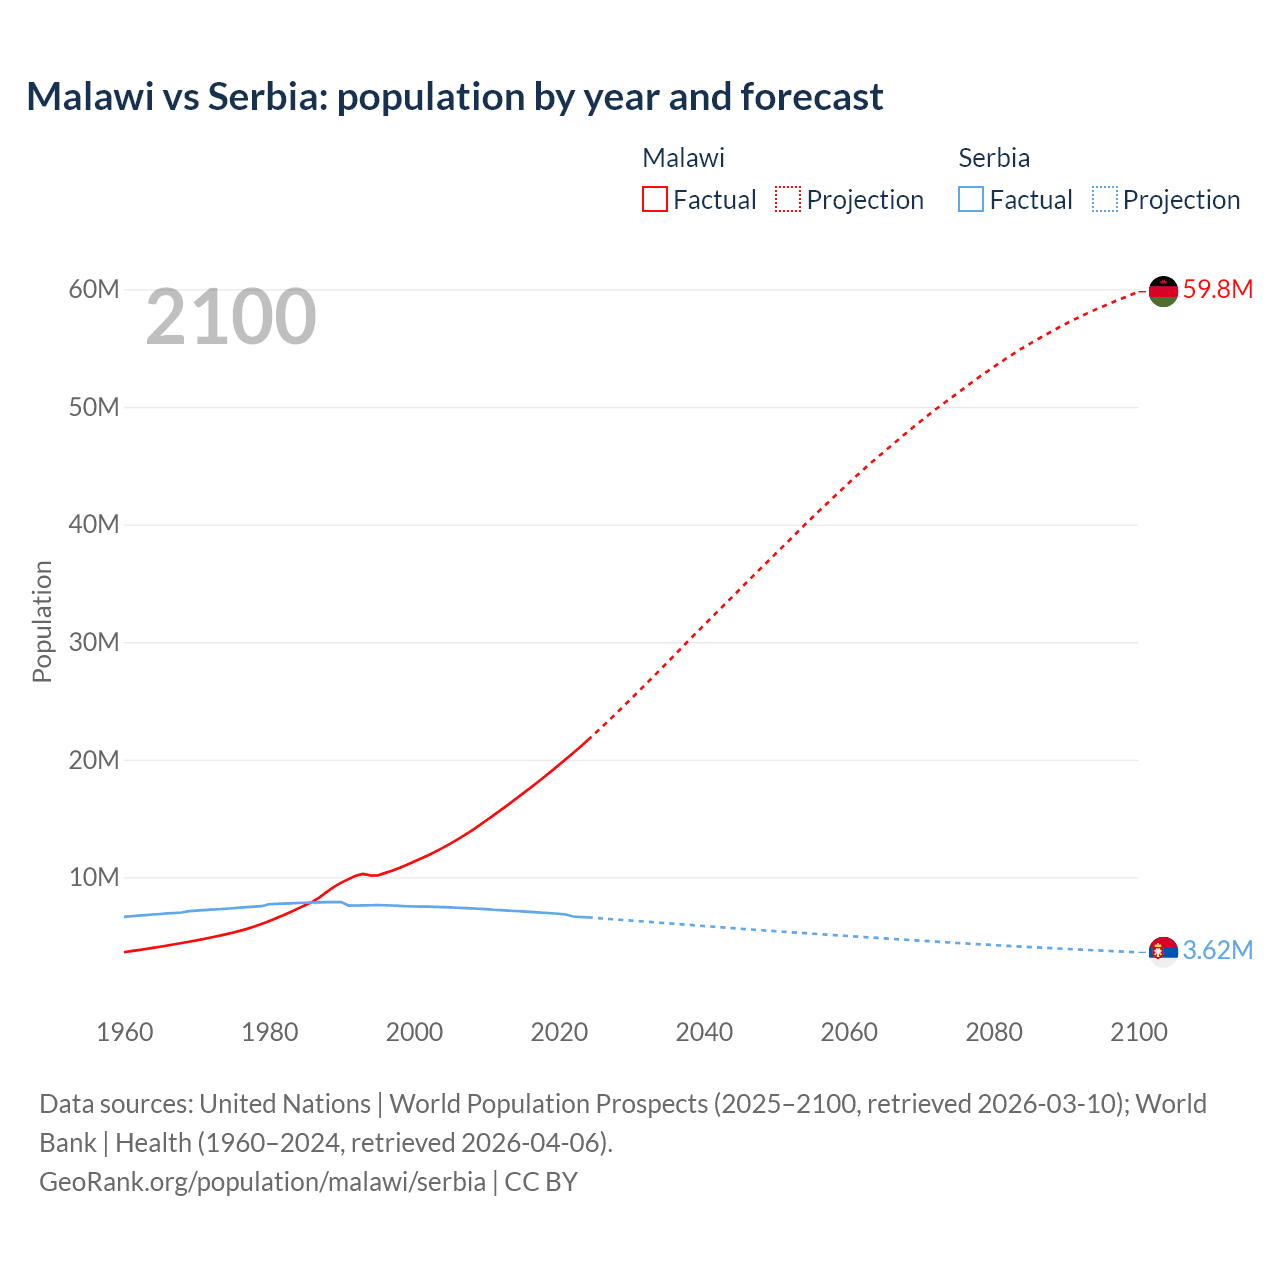
Malawi vs Serbia: population by year and forecast
| Year | Population | |
|---|---|---|
 Malawi
|
 Serbia
|
|
| 2100 | 59,773,923 | 3,624,616 |
| 2099 | 59,515,624 | 3,652,806 |
| 2098 | 59,263,165 | 3,681,036 |
| 2097 | 59,015,654 | 3,709,552 |
| 2096 | 58,749,288 | 3,738,231 |
| 2095 | 58,495,699 | 3,767,093 |
| 2094 | 58,227,933 | 3,796,201 |
| 2093 | 57,954,358 | 3,825,522 |
| 2092 | 57,660,371 | 3,855,267 |
| 2091 | 57,364,786 | 3,885,260 |
| 2090 | 57,048,240 | 3,915,419 |
| 2089 | 56,727,243 | 3,946,052 |
| 2088 | 56,385,237 | 3,976,782 |
| 2087 | 56,041,651 | 4,008,021 |
| 2086 | 55,694,983 | 4,039,630 |
| 2085 | 55,336,839 | 4,071,614 |
| 2084 | 54,985,304 | 4,104,024 |
| 2083 | 54,593,349 | 4,137,041 |
| 2082 | 54,194,853 | 4,170,603 |
| 2081 | 53,783,781 | 4,204,520 |
| 2080 | 53,361,334 | 4,239,046 |
| 2079 | 52,936,889 | 4,274,213 |
| 2078 | 52,510,645 | 4,310,048 |
| 2077 | 52,052,767 | 4,346,216 |
| 2076 | 51,589,339 | 4,382,620 |
| 2075 | 51,130,762 | 4,419,404 |
| 2074 | 50,673,499 | 4,456,820 |
| 2073 | 50,218,991 | 4,494,554 |
| 2072 | 49,759,232 | 4,532,671 |
| 2071 | 49,276,570 | 4,571,200 |
| 2070 | 48,787,471 | 4,610,279 |
| 2069 | 48,291,287 | 4,649,626 |
| 2068 | 47,782,059 | 4,689,227 |
| 2067 | 47,267,335 | 4,728,969 |
| 2066 | 46,741,998 | 4,768,652 |
| 2065 | 46,218,226 | 4,808,648 |
| 2064 | 45,692,044 | 4,848,712 |
| 2063 | 45,169,634 | 4,888,888 |
| 2062 | 44,629,192 | 4,929,248 |
| 2061 | 44,067,259 | 4,969,370 |
| 2060 | 43,499,372 | 5,009,557 |
| 2059 | 42,907,491 | 5,049,580 |
| 2058 | 42,335,782 | 5,089,783 |
| 2057 | 41,753,105 | 5,130,427 |
| 2056 | 41,175,330 | 5,171,093 |
| 2055 | 40,576,247 | 5,211,735 |
| 2054 | 39,986,120 | 5,252,427 |
| 2053 | 39,369,178 | 5,293,039 |
| 2052 | 38,758,577 | 5,334,193 |
| 2051 | 38,145,141 | 5,376,024 |
| 2050 | 37,537,814 | 5,417,847 |
| 2049 | 36,928,354 | 5,460,219 |
| 2048 | 36,332,040 | 5,502,886 |
| 2047 | 35,717,466 | 5,546,051 |
| 2046 | 35,099,651 | 5,589,756 |
| 2045 | 34,484,520 | 5,634,078 |
| 2044 | 33,855,018 | 5,678,918 |
| 2043 | 33,240,675 | 5,724,337 |
| 2042 | 32,629,513 | 5,770,492 |
| 2041 | 32,012,581 | 5,817,068 |
| 2040 | 31,395,572 | 5,863,637 |
| 2039 | 30,775,878 | 5,910,619 |
| 2038 | 30,160,239 | 5,957,363 |
| 2037 | 29,521,489 | 6,004,061 |
| 2036 | 28,890,318 | 6,050,436 |
| 2035 | 28,261,909 | 6,096,764 |
| 2034 | 27,637,439 | 6,142,866 |
| 2033 | 27,012,311 | 6,188,997 |
| 2032 | 26,398,409 | 6,234,637 |
| 2031 | 25,790,366 | 6,279,936 |
| 2030 | 25,176,420 | 6,325,002 |
| 2029 | 24,561,210 | 6,369,418 |
| 2028 | 23,962,931 | 6,413,572 |
| 2027 | 23,369,575 | 6,457,306 |
| 2026 | 22,786,713 | 6,500,256 |
| 2025 | 22,216,120 | 6,549,143 |
| 2024 | 21,655,286 | 6,586,476 |
| 2023 | 21,104,482 | 6,623,183 |
| 2022 | 20,568,728 | 6,664,449 |
| 2021 | 20,047,258 | 6,834,326 |
| 2020 | 19,533,888 | 6,899,126 |
| 2019 | 19,025,752 | 6,945,235 |
| 2018 | 18,528,081 | 6,982,604 |
| 2017 | 18,039,715 | 7,020,858 |
| 2016 | 17,557,739 | 7,058,322 |
| 2015 | 17,085,587 | 7,095,383 |
| 2014 | 16,621,538 | 7,131,787 |
| 2013 | 16,161,816 | 7,166,553 |
| 2012 | 15,709,577 | 7,201,497 |
| 2011 | 15,265,022 | 7,236,519 |
| 2010 | 14,826,463 | 7,291,436 |
| 2009 | 14,395,788 | 7,320,807 |
| 2008 | 13,976,417 | 7,350,222 |
| 2007 | 13,576,343 | 7,381,579 |
| 2006 | 13,198,701 | 7,411,569 |
| 2005 | 12,840,031 | 7,440,769 |
| 2004 | 12,500,737 | 7,463,157 |
| 2003 | 12,181,574 | 7,480,591 |
| 2002 | 11,880,440 | 7,500,031 |
| 2001 | 11,593,058 | 7,503,433 |
| 2000 | 11,315,942 | 7,516,346 |
| 1999 | 11,047,804 | 7,540,401 |
| 1998 | 10,792,876 | 7,567,745 |
| 1997 | 10,562,035 | 7,598,538 |
| 1996 | 10,352,228 | 7,622,185 |
| 1995 | 10,150,117 | 7,628,264 |
| 1994 | 10,164,894 | 7,622,711 |
| 1993 | 10,284,024 | 7,614,328 |
| 1992 | 10,135,079 | 7,604,063 |
| 1991 | 9,844,227 | 7,595,636 |
| 1990 | 9,545,852 | 7,897,937 |
| 1989 | 9,176,220 | 7,893,787 |
| 1988 | 8,753,262 | 7,884,218 |
| 1987 | 8,293,174 | 7,868,027 |
| 1986 | 7,906,480 | 7,853,824 |
| 1985 | 7,620,508 | 7,835,902 |
| 1984 | 7,332,810 | 7,813,549 |
| 1983 | 7,051,709 | 7,788,100 |
| 1982 | 6,778,879 | 7,763,335 |
| 1981 | 6,516,454 | 7,736,787 |
| 1980 | 6,265,529 | 7,709,544 |
| 1979 | 6,028,749 | 7,541,997 |
| 1978 | 5,810,132 | 7,504,017 |
| 1977 | 5,614,983 | 7,462,783 |
| 1976 | 5,443,384 | 7,418,973 |
| 1975 | 5,287,367 | 7,368,717 |
| 1974 | 5,141,337 | 7,326,043 |
| 1973 | 5,003,938 | 7,283,902 |
| 1972 | 4,874,475 | 7,252,012 |
| 1971 | 4,751,434 | 7,211,716 |
| 1970 | 4,633,944 | 7,164,993 |
| 1969 | 4,521,184 | 7,123,249 |
| 1968 | 4,411,054 | 7,007,586 |
| 1967 | 4,303,012 | 6,966,522 |
| 1966 | 4,197,926 | 6,927,969 |
| 1965 | 4,096,157 | 6,876,624 |
| 1964 | 3,997,305 | 6,832,855 |
| 1963 | 3,900,506 | 6,787,950 |
| 1962 | 3,806,307 | 6,740,264 |
| 1961 | 3,715,534 | 6,689,077 |
| 1960 | 3,628,134 | 6,638,992 |
Data sources: United Nations | World Population Prospects (2026–2100, retrieved 2026-07-08); World Bank | Health (1960–2025, retrieved 2026-07-08).
GeoRank.org/population/malawi/serbia | CC BY 
From 2006 to 2016, the population of Malawi increased by 4,359,038 people (a 33% growth), while Serbia lost 353,247 people (a 4.77% decline).
For the next 10 years, from 2016 to 2026, Malawi gained 5,528,367 people (a 31.5% growth), while Serbia's population decreased by 558,066 people (a 7.91% decline).
Malawi was ranked 69th most populous country in 2006 and is 61st in 2026. Serbia was ranked 97th in 2006 and ranked 110th now.
The UN's World Population Prospects forecasts that in 24 years (in 2050) Malawi's population will grow by 62.6% to 37,537,814 people with a rank change from 61st to 55th. The population of Serbia will decrease by 16.7% to 5,417,847 people and rank change from 110th to 125th.
Malawi is projected to reach its peak in 2100 at 59.8M people, while Serbia's population already peaked in 1990 at 7.9M people and is projected to decrease to 3.62M people by 2100.
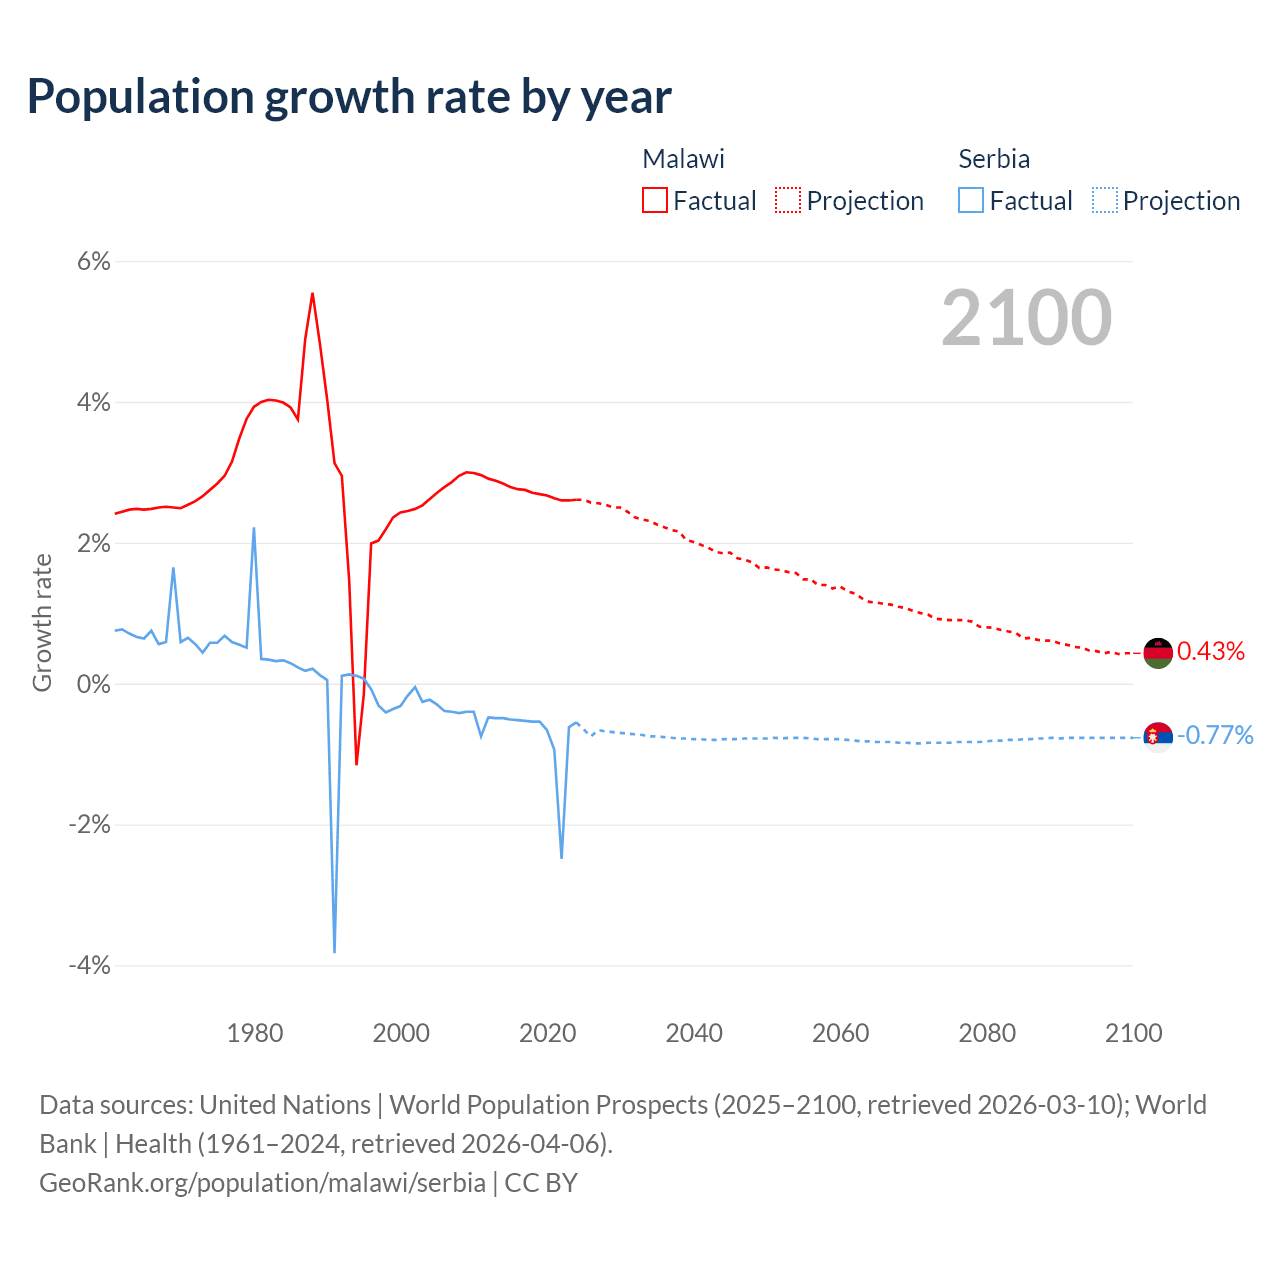
Population growth rate by year
| Year | Growth rate | |
|---|---|---|
|
Malawi
|
Serbia
|
|
| 2100 | 0.43% | -0.77% |
| 2099 | 0.43% | -0.77% |
| 2098 | 0.42% | -0.77% |
| 2097 | 0.45% | -0.77% |
| 2096 | 0.43% | -0.77% |
| 2095 | 0.46% | -0.77% |
| 2094 | 0.47% | -0.77% |
| 2093 | 0.51% | -0.77% |
| 2092 | 0.52% | -0.77% |
| 2091 | 0.55% | -0.77% |
| 2090 | 0.57% | -0.78% |
| 2089 | 0.61% | -0.77% |
| 2088 | 0.61% | -0.78% |
| 2087 | 0.62% | -0.78% |
| 2086 | 0.65% | -0.79% |
| 2085 | 0.64% | -0.79% |
| 2084 | 0.72% | -0.8% |
| 2083 | 0.74% | -0.8% |
| 2082 | 0.76% | -0.81% |
| 2081 | 0.79% | -0.81% |
| 2080 | 0.8% | -0.82% |
| 2079 | 0.81% | -0.83% |
| 2078 | 0.88% | -0.83% |
| 2077 | 0.9% | -0.83% |
| 2076 | 0.9% | -0.83% |
| 2075 | 0.9% | -0.84% |
| 2074 | 0.91% | -0.84% |
| 2073 | 0.92% | -0.84% |
| 2072 | 0.98% | -0.84% |
| 2071 | 1% | -0.85% |
| 2070 | 1.03% | -0.85% |
| 2069 | 1.07% | -0.84% |
| 2068 | 1.09% | -0.84% |
| 2067 | 1.12% | -0.83% |
| 2066 | 1.13% | -0.83% |
| 2065 | 1.15% | -0.83% |
| 2064 | 1.16% | -0.82% |
| 2063 | 1.21% | -0.82% |
| 2062 | 1.28% | -0.81% |
| 2061 | 1.31% | -0.8% |
| 2060 | 1.38% | -0.79% |
| 2059 | 1.35% | -0.79% |
| 2058 | 1.4% | -0.79% |
| 2057 | 1.4% | -0.79% |
| 2056 | 1.48% | -0.78% |
| 2055 | 1.48% | -0.77% |
| 2054 | 1.57% | -0.77% |
| 2053 | 1.58% | -0.77% |
| 2052 | 1.61% | -0.78% |
| 2051 | 1.62% | -0.77% |
| 2050 | 1.65% | -0.78% |
| 2049 | 1.64% | -0.78% |
| 2048 | 1.72% | -0.78% |
| 2047 | 1.76% | -0.78% |
| 2046 | 1.78% | -0.79% |
| 2045 | 1.86% | -0.79% |
| 2044 | 1.85% | -0.79% |
| 2043 | 1.87% | -0.8% |
| 2042 | 1.93% | -0.8% |
| 2041 | 1.97% | -0.79% |
| 2040 | 2.01% | -0.79% |
| 2039 | 2.04% | -0.78% |
| 2038 | 2.16% | -0.78% |
| 2037 | 2.18% | -0.77% |
| 2036 | 2.22% | -0.76% |
| 2035 | 2.26% | -0.75% |
| 2034 | 2.31% | -0.75% |
| 2033 | 2.33% | -0.73% |
| 2032 | 2.36% | -0.72% |
| 2031 | 2.44% | -0.71% |
| 2030 | 2.5% | -0.7% |
| 2029 | 2.5% | -0.69% |
| 2028 | 2.54% | -0.68% |
| 2027 | 2.56% | -0.66% |
| 2026 | 2.57% | -0.75% |
| 2025 | 2.59% | -0.57% |
| 2024 | 2.61% | -0.55% |
| 2023 | 2.6% | -0.62% |
| 2022 | 2.6% | -2.49% |
| 2021 | 2.63% | -0.94% |
| 2020 | 2.67% | -0.66% |
| 2019 | 2.69% | -0.54% |
| 2018 | 2.71% | -0.54% |
| 2017 | 2.75% | -0.53% |
| 2016 | 2.76% | -0.52% |
| 2015 | 2.79% | -0.51% |
| 2014 | 2.84% | -0.49% |
| 2013 | 2.88% | -0.49% |
| 2012 | 2.91% | -0.48% |
| 2011 | 2.96% | -0.75% |
| 2010 | 2.99% | -0.4% |
| 2009 | 3% | -0.4% |
| 2008 | 2.95% | -0.42% |
| 2007 | 2.86% | -0.4% |
| 2006 | 2.79% | -0.39% |
| 2005 | 2.71% | -0.3% |
| 2004 | 2.62% | -0.23% |
| 2003 | 2.53% | -0.26% |
| 2002 | 2.48% | -0.05% |
| 2001 | 2.45% | -0.17% |
| 2000 | 2.43% | -0.32% |
| 1999 | 2.36% | -0.36% |
| 1998 | 2.19% | -0.41% |
| 1997 | 2.03% | -0.31% |
| 1996 | 1.99% | -0.08% |
| 1995 | -0.15% | 0.07% |
| 1994 | -1.16% | 0.11% |
| 1993 | 1.47% | 0.13% |
| 1992 | 2.95% | 0.11% |
| 1991 | 3.13% | -3.83% |
| 1990 | 4.03% | 0.05% |
| 1989 | 4.83% | 0.12% |
| 1988 | 5.55% | 0.21% |
| 1987 | 4.89% | 0.18% |
| 1986 | 3.75% | 0.23% |
| 1985 | 3.92% | 0.29% |
| 1984 | 3.99% | 0.33% |
| 1983 | 4.02% | 0.32% |
| 1982 | 4.03% | 0.34% |
| 1981 | 4% | 0.35% |
| 1980 | 3.93% | 2.22% |
| 1979 | 3.76% | 0.51% |
| 1978 | 3.48% | 0.55% |
| 1977 | 3.15% | 0.59% |
| 1976 | 2.95% | 0.68% |
| 1975 | 2.84% | 0.58% |
| 1974 | 2.75% | 0.58% |
| 1973 | 2.66% | 0.44% |
| 1972 | 2.59% | 0.56% |
| 1971 | 2.54% | 0.65% |
| 1970 | 2.49% | 0.59% |
| 1969 | 2.5% | 1.65% |
| 1968 | 2.51% | 0.59% |
| 1967 | 2.5% | 0.56% |
| 1966 | 2.48% | 0.75% |
| 1965 | 2.47% | 0.64% |
| 1964 | 2.48% | 0.66% |
| 1963 | 2.47% | 0.71% |
| 1962 | 2.44% | 0.77% |
| 1961 | 2.41% | 0.75% |
Data sources: United Nations | World Population Prospects (2026–2100, retrieved 2026-07-08); World Bank | Health (1961–2025, retrieved 2026-07-08).
GeoRank.org/population/malawi/serbia | CC BY
In 2025, the population of Malawi grew by 2.59%, while Serbia's population declined by 0.57%.
Live population counters
|
Malawi
|
Serbia
|
|
|---|---|---|
| Current population |
23086106
|
6500256
|
| Population rank | 61/197 | 110/197 |
| Percent of world population | 0.28% | 0.08% |
| One net population change |
56.4 seconds
|
14.1 minutes
|
| One birth every |
46.8 seconds
|
8.67 minutes
|
| One death every |
4.59 minutes
|
5.36 minutes
|
| Daily growth/decline | +1,537 | -102 |
| Annual growth/decline | +560,834 | -37,333 |
| Annual growth/decline rate | +2.59% | -0.57% |
| Population growth rate rank | 23/197 | 187/197 |
| One migration net change every |
1.56 hours
|
40.3 minutes
|
| Annual migration change | -5,628 | -13,086 |
| Net migration rank | 118/196 | 140/196 |
| Foreign-born residents | 186,719 | 712,550 |
| Foreign-born residents rank | 117/195 | 70/195 |
| Foreign-born share of population | 0.9% | 10.6% |
| Foreign-born share rank | 158/195 | 64/195 |
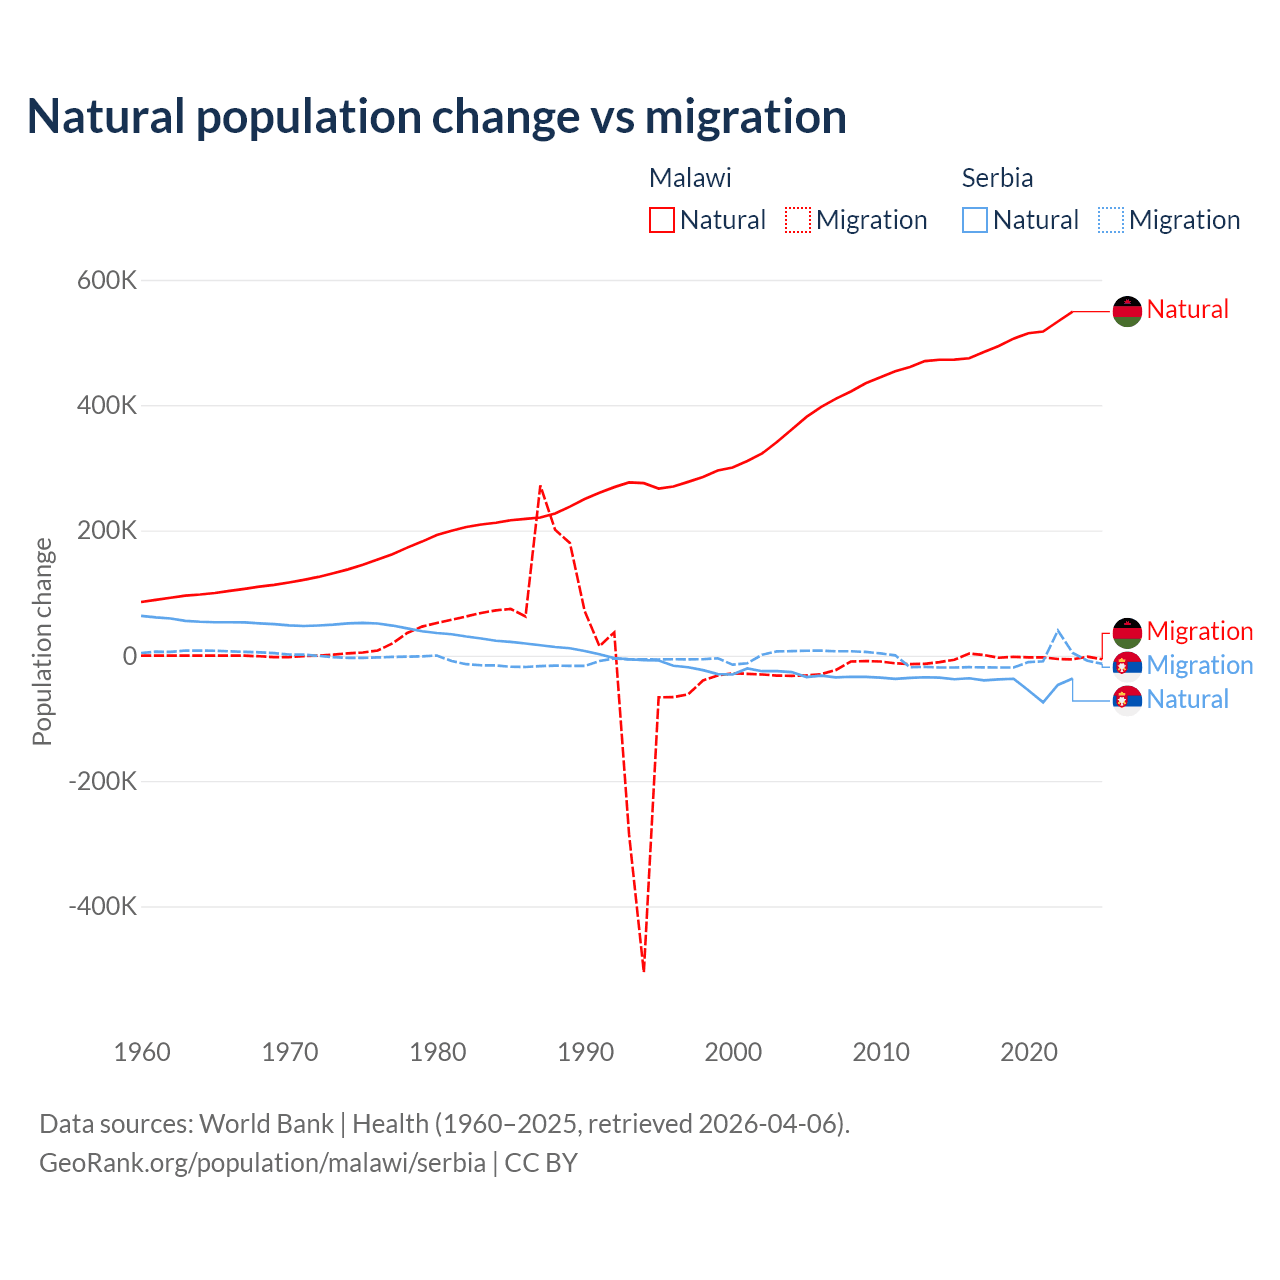
Natural population change vs migration
| Year | Population change | |||
|---|---|---|---|---|
|
Malawi
|
Serbia
|
|||
| Natural | Migration | Natural | Migration | |
| 2025 | - | -5,628 | - | -13,086 |
| 2024 | 559,811 | -1,507 | -37,543 | -8,132 |
| 2023 | 549,096 | -5,811 | -36,427 | 4,348 |
| 2022 | 533,450 | -5,231 | -46,651 | 40,118 |
| 2021 | 517,400 | -2,666 | -74,494 | -8,974 |
| 2020 | 514,659 | -2,655 | -55,193 | -10,220 |
| 2019 | 506,104 | -1,837 | -36,810 | -18,891 |
| 2018 | 494,348 | -3,267 | -37,707 | -18,883 |
| 2017 | 484,655 | 982 | -39,317 | -18,651 |
| 2016 | 474,779 | 3,505 | -35,998 | -18,322 |
| 2015 | 472,484 | -6,471 | -37,605 | -18,789 |
| 2014 | 472,418 | -10,317 | -34,946 | -18,846 |
| 2013 | 470,293 | -12,934 | -34,399 | -17,866 |
| 2012 | 460,684 | -13,561 | -35,288 | -18,513 |
| 2011 | 454,149 | -12,170 | -36,906 | 611 |
| 2010 | 444,468 | -9,327 | -34,999 | 3,632 |
| 2009 | 434,811 | -8,590 | -33,676 | 6,043 |
| 2008 | 421,781 | -9,264 | -33,590 | 7,070 |
| 2007 | 410,290 | -22,680 | -34,693 | 7,045 |
| 2006 | 397,123 | -29,450 | -31,870 | 8,018 |
| 2005 | 381,130 | -31,462 | -34,227 | 7,945 |
| 2004 | 361,133 | -32,221 | -26,121 | 7,300 |
| 2003 | 341,133 | -31,729 | -24,686 | 6,854 |
| 2002 | 322,863 | -30,013 | -24,750 | 1,562 |
| 2001 | 310,833 | -28,933 | -20,259 | -12,007 |
| 2000 | 300,439 | -28,098 | -30,065 | -14,368 |
| 1999 | 295,629 | -31,686 | -29,408 | -4,073 |
| 1998 | 285,407 | -39,491 | -23,006 | -5,665 |
| 1997 | 277,433 | -61,646 | -18,389 | -5,817 |
| 1996 | 270,048 | -66,212 | -16,007 | -5,598 |
| 1995 | 266,745 | -66,366 | -7,628 | -6,019 |
| 1994 | 275,439 | -505,365 | -7,157 | -5,934 |
| 1993 | 276,538 | -284,867 | -5,703 | -5,972 |
| 1992 | 269,066 | 37,142 | -3,779 | -4,415 |
| 1991 | 260,193 | 15,291 | 2,210 | -8,483 |
| 1990 | 250,159 | 71,111 | 7,416 | -16,260 |
| 1989 | 237,967 | 180,031 | 11,872 | -16,360 |
| 1988 | 226,911 | 201,011 | 13,852 | -15,715 |
| 1987 | 220,566 | 271,693 | 16,711 | -16,686 |
| 1986 | 218,519 | 62,615 | 19,407 | -17,990 |
| 1985 | 216,179 | 74,625 | 22,090 | -17,646 |
| 1984 | 212,146 | 72,435 | 23,815 | -15,567 |
| 1983 | 209,422 | 68,197 | 27,515 | -15,301 |
| 1982 | 205,386 | 62,661 | 30,603 | -13,550 |
| 1981 | 199,436 | 57,376 | 34,304 | -8,531 |
| 1980 | 192,746 | 52,294 | 36,273 | 287 |
| 1979 | 182,123 | 46,388 | 39,022 | -960 |
| 1978 | 172,503 | 36,225 | 43,636 | -1,481 |
| 1977 | 161,930 | 19,638 | 48,105 | -1,953 |
| 1976 | 153,422 | 8,206 | 51,399 | -2,744 |
| 1975 | 145,254 | 5,162 | 52,502 | -3,490 |
| 1974 | 137,819 | 3,833 | 51,583 | -3,525 |
| 1973 | 131,529 | 1,623 | 49,596 | -2,396 |
| 1972 | 125,728 | 48 | 48,248 | -348 |
| 1971 | 121,015 | -710 | 47,424 | 1,655 |
| 1970 | 116,822 | -2,147 | 48,343 | 1,861 |
| 1969 | 113,120 | -2,266 | 50,304 | 4,112 |
| 1968 | 110,329 | -924 | 51,653 | 5,430 |
| 1967 | 106,668 | 0 | 53,120 | 6,114 |
| 1966 | 103,512 | 0 | 53,338 | 7,037 |
| 1965 | 100,040 | 0 | 53,383 | 7,957 |
| 1964 | 97,658 | 0 | 54,185 | 8,045 |
| 1963 | 95,933 | 0 | 55,580 | 8,276 |
| 1962 | 92,463 | 0 | 59,307 | 6,064 |
| 1961 | 89,091 | 0 | 61,065 | 6,422 |
| 1960 | 85,718 | 0 | 63,642 | 4,377 |
Data sources: World Bank | Health (1960–2025, retrieved 2026-07-08).
GeoRank.org/population/malawi/serbia | CC BY
Over the last 10 years, 99.5% of the population change in Malawi is from natural causes (a gain of 5,106,786 people) and 0.49% is from migration (a loss of 24,958 people). In Serbia 85.1% is from natural causes (a loss of 437,745 people) and 14.9% is from migration (a loss of 76,396 people).
As of 2024, 186,719 residents or 0.9% of the population were not native-born in Malawi, compared to 712,550 people or 10.6% in Serbia.
Biggest cities by population
|
Malawi
|
|
|---|---|
| City | Population |
| Lilongwe | 989K |
| Mzimba | 936K |
| Blantyre | 800K |
| Mzuzu | 150K |
| Zomba | 101K |
| Mangochi | 53.5K |
| Mulanje | 14.8K |
| Ntcheu | 14.6K |
| Monkey Bay | 14.6K |
|
Serbia
|
|
|---|---|
| City | Population |
| Belgrade | 1.2M |
| Novi Sad | 260K |
| Pristina | 227K |
| Nis | 183K |
| Kragujevac | 151K |
| Subotica | 106K |
| Valjevo | 90.3K |
| Cacak | 71.9K |
| Mitrovica | 71.6K |
| Novi Pazar | 66.5K |
Compare countries by 7 more topics
Population differences between Malawi and Serbia
|
Malawi
|
Serbia
|
|
|---|---|---|
| Life expectancy | 67.9 years | 77.3 years |
| Average age | 23 years | 44.2 years |
| Median age | 19.2 years | 45.4 years |
| Male:Female ratio | 48.8:51.2 | 47.4:52.6 |
| Fertility rate | 3.59 births per woman | 1.64 births per woman |
| Population density | 626 ppl/mi² | 200.2 ppl/mi² |
Population map with other countries
Data sources: World Bank | Health (1960–2025, retrieved 2026-07-08); United Nations | World Population Prospects (1960–2026, retrieved 2026-07-08); U.S. Census Bureau (1960–2025, retrieved 2026-07-08); Central Intelligence Agency (CIA) (2000–2019, retrieved 2026-07-08).
GeoRank.org/population/malawi/serbia | CC BY
Help us show the world through your eyes
Share a photo of your city and help others discover what it looks like to live there. Your contribution makes our data come alive.
Data sources:
- World Bank | Health (1960–2025, retrieved 2026-07-08)
- United Nations | World Population Prospects (1960–2100, retrieved 2026-07-08)
- U.S. Census Bureau (1960–2025, retrieved 2026-07-08)
- Wikidata (2026, retrieved 2026-07-08)
- Central Intelligence Agency (CIA) (2000–2019, retrieved 2026-07-08)
Creative Commons Attribution (CC BY) — you’re free to copy, share, remix, adapt, and use even commercially as long as you give appropriate credit and clearly indicate if you made changes. Other sources may be subject to different license terms.