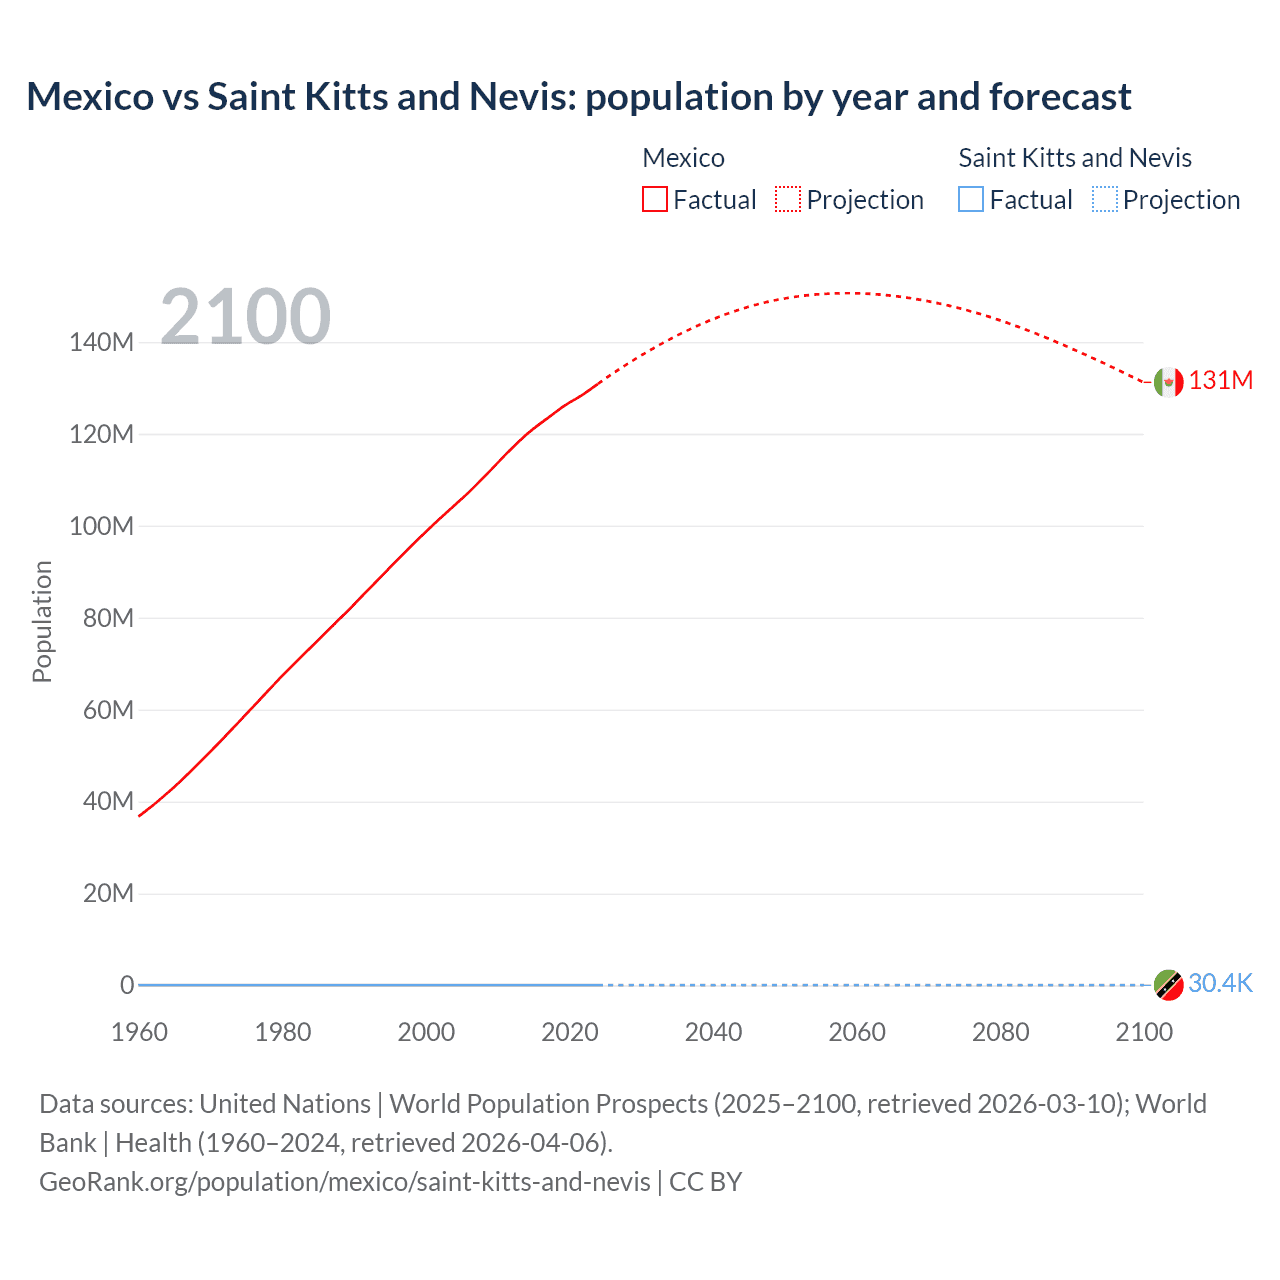
The latest officially reported population of Mexico was 131,946,900 in 2025 vs 46,922 people in Saint Kitts and Nevis in 2025. In 2026, based on the adjusted UN estimation, the current Mexico's population is 133,551,566 people compared to 47,031 in Saint Kitts and Nevis.
Population statistics:
- Mexico's population is 2,840 times bigger than Saint Kitts and Nevis'.
- Mexico is ranked the 11th most populous country in the world, while Saint Kitts and Nevis is the 189th.
- The countries together account for 1.61% of the world: 1.61% for Mexico vs 0.0006% for Saint Kitts and Nevis.
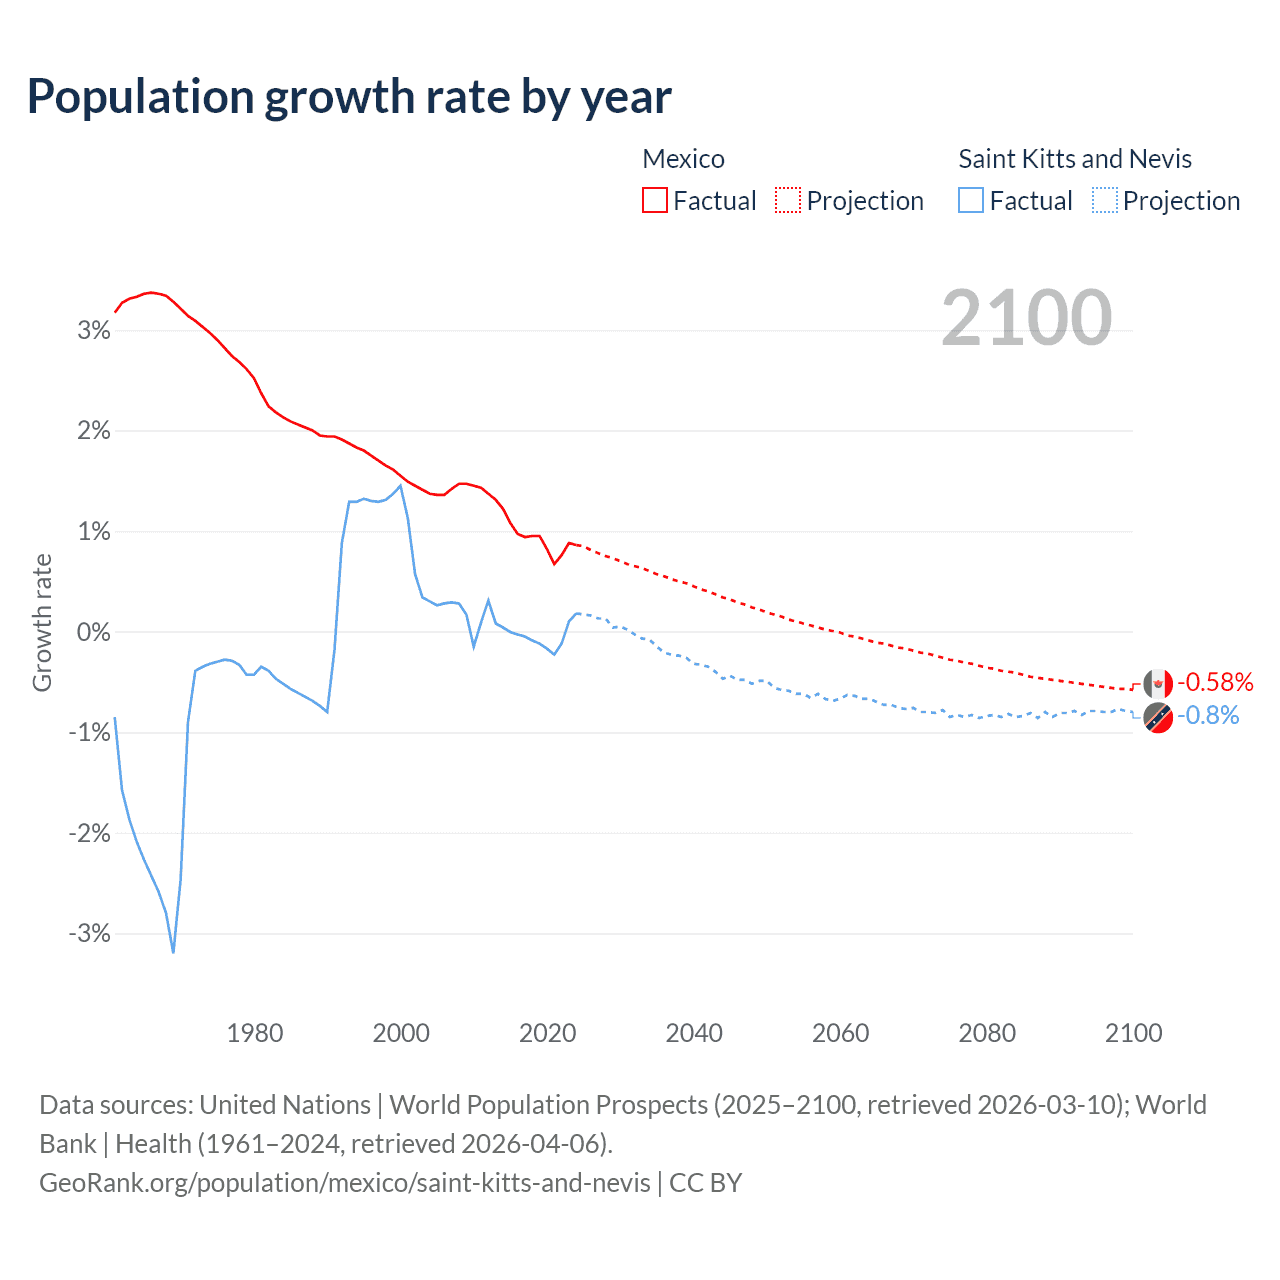
- For the last 10 years, Mexico has had an average growth rate of +0.88% per year vs -0.03% in Saint Kitts and Nevis.
- Since 2006, the population of Mexico has increased from 107M people to 134M (24.5% growth), while Saint Kitts and Nevis has grown from 46.6K to 47K (0.99% growth).
Mexico vs Saint Kitts and Nevis: population by year and forecast
| Year | Population | |
|---|---|---|
 Mexico
|
 Saint Kitts
|
|
| 2100 | 131,158,772 | 30,378 |
| 2099 | 131,919,278 | 30,622 |
| 2098 | 132,676,226 | 30,866 |
| 2097 | 133,430,730 | 31,106 |
| 2096 | 134,179,811 | 31,357 |
| 2095 | 134,924,667 | 31,609 |
| 2094 | 135,662,399 | 31,861 |
| 2093 | 136,390,414 | 32,116 |
| 2092 | 137,102,695 | 32,383 |
| 2091 | 137,808,909 | 32,643 |
| 2090 | 138,501,995 | 32,908 |
| 2089 | 139,183,536 | 33,175 |
| 2088 | 139,849,476 | 33,459 |
| 2087 | 140,504,916 | 33,730 |
| 2086 | 141,148,688 | 34,022 |
| 2085 | 141,779,696 | 34,299 |
| 2084 | 142,390,038 | 34,588 |
| 2083 | 142,983,168 | 34,884 |
| 2082 | 143,553,646 | 35,173 |
| 2081 | 144,112,618 | 35,473 |
| 2080 | 144,651,130 | 35,768 |
| 2079 | 145,168,756 | 36,072 |
| 2078 | 145,664,735 | 36,384 |
| 2077 | 146,138,472 | 36,688 |
| 2076 | 146,589,999 | 37,001 |
| 2075 | 147,020,176 | 37,312 |
| 2074 | 147,428,934 | 37,630 |
| 2073 | 147,814,398 | 37,926 |
| 2072 | 148,174,180 | 38,236 |
| 2071 | 148,507,034 | 38,544 |
| 2070 | 148,821,087 | 38,854 |
| 2069 | 149,107,578 | 39,150 |
| 2068 | 149,368,537 | 39,454 |
| 2067 | 149,603,163 | 39,756 |
| 2066 | 149,814,864 | 40,049 |
| 2065 | 150,001,973 | 40,345 |
| 2064 | 150,160,667 | 40,630 |
| 2063 | 150,292,498 | 40,904 |
| 2062 | 150,396,857 | 41,179 |
| 2061 | 150,474,868 | 41,444 |
| 2060 | 150,528,257 | 41,706 |
| 2059 | 150,549,825 | 41,986 |
| 2058 | 150,541,650 | 42,277 |
| 2057 | 150,507,950 | 42,561 |
| 2056 | 150,447,865 | 42,825 |
| 2055 | 150,356,976 | 43,109 |
| 2054 | 150,235,899 | 43,377 |
| 2053 | 150,083,305 | 43,646 |
| 2052 | 149,896,641 | 43,905 |
| 2051 | 149,677,830 | 44,162 |
| 2050 | 149,423,583 | 44,409 |
| 2049 | 149,138,900 | 44,627 |
| 2048 | 148,809,771 | 44,845 |
| 2047 | 148,451,951 | 45,079 |
| 2046 | 148,054,747 | 45,296 |
| 2045 | 147,620,456 | 45,513 |
| 2044 | 147,146,325 | 45,714 |
| 2043 | 146,641,077 | 45,930 |
| 2042 | 146,096,981 | 46,112 |
| 2041 | 145,517,171 | 46,275 |
| 2040 | 144,905,265 | 46,427 |
| 2039 | 144,260,027 | 46,575 |
| 2038 | 143,575,746 | 46,698 |
| 2037 | 142,857,009 | 46,808 |
| 2036 | 142,113,069 | 46,918 |
| 2035 | 141,334,167 | 47,016 |
| 2034 | 140,529,082 | 47,088 |
| 2033 | 139,687,630 | 47,127 |
| 2032 | 138,818,384 | 47,162 |
| 2031 | 137,922,237 | 47,178 |
| 2030 | 136,998,375 | 47,168 |
| 2029 | 136,046,964 | 47,143 |
| 2028 | 135,066,178 | 47,123 |
| 2027 | 134,056,943 | 47,062 |
| 2026 | 133,017,798 | 46,999 |
| 2025 | 131,946,900 | 46,922 |
| 2024 | 130,861,007 | 46,843 |
| 2023 | 129,739,759 | 46,758 |
| 2022 | 128,613,117 | 46,709 |
| 2021 | 127,648,148 | 46,763 |
| 2020 | 126,799,054 | 46,870 |
| 2019 | 125,762,982 | 46,952 |
| 2018 | 124,573,711 | 47,008 |
| 2017 | 123,400,057 | 47,050 |
| 2016 | 122,251,351 | 47,075 |
| 2015 | 121,072,306 | 47,087 |
| 2014 | 119,784,261 | 47,089 |
| 2013 | 118,343,573 | 47,069 |
| 2012 | 116,818,208 | 47,033 |
| 2011 | 115,243,504 | 46,886 |
| 2010 | 113,623,895 | 46,846 |
| 2009 | 111,999,721 | 46,916 |
| 2008 | 110,374,288 | 46,835 |
| 2007 | 108,774,360 | 46,706 |
| 2006 | 107,253,666 | 46,569 |
| 2005 | 105,811,504 | 46,437 |
| 2004 | 104,394,131 | 46,315 |
| 2003 | 102,978,515 | 46,176 |
| 2002 | 101,548,624 | 46,020 |
| 2001 | 100,099,099 | 45,761 |
| 2000 | 98,625,552 | 45,248 |
| 1999 | 97,115,707 | 44,601 |
| 1998 | 95,575,245 | 43,998 |
| 1997 | 94,021,207 | 43,428 |
| 1996 | 92,452,702 | 42,877 |
| 1995 | 90,862,455 | 42,326 |
| 1994 | 89,259,205 | 41,776 |
| 1993 | 87,653,807 | 41,242 |
| 1992 | 86,044,809 | 40,715 |
| 1991 | 84,430,572 | 40,358 |
| 1990 | 82,820,170 | 40,432 |
| 1989 | 81,247,182 | 40,758 |
| 1988 | 79,695,531 | 41,062 |
| 1987 | 78,136,651 | 41,348 |
| 1986 | 76,585,637 | 41,618 |
| 1985 | 75,043,414 | 41,874 |
| 1984 | 73,506,846 | 42,113 |
| 1983 | 71,971,240 | 42,334 |
| 1982 | 70,433,260 | 42,532 |
| 1981 | 68,892,108 | 42,698 |
| 1980 | 67,300,334 | 42,850 |
| 1979 | 65,648,865 | 43,033 |
| 1978 | 63,979,046 | 43,217 |
| 1977 | 62,308,493 | 43,358 |
| 1976 | 60,645,512 | 43,482 |
| 1975 | 58,982,400 | 43,606 |
| 1974 | 57,320,149 | 43,738 |
| 1973 | 55,667,284 | 43,880 |
| 1972 | 54,030,168 | 44,033 |
| 1971 | 52,412,558 | 44,206 |
| 1970 | 50,814,953 | 44,606 |
| 1969 | 49,233,194 | 45,731 |
| 1968 | 47,668,303 | 47,245 |
| 1967 | 46,129,608 | 48,605 |
| 1966 | 44,629,106 | 49,898 |
| 1965 | 43,174,477 | 51,139 |
| 1964 | 41,772,049 | 52,326 |
| 1963 | 40,424,065 | 53,441 |
| 1962 | 39,129,200 | 54,461 |
| 1961 | 37,890,118 | 55,334 |
| 1960 | 36,724,615 | 55,810 |
Data sources: United Nations | World Population Prospects (2026–2100, retrieved 2026-07-08); World Bank | Health (1960–2025, retrieved 2026-07-08).
GeoRank.org/population/mexico/saint-kitts-and-nevis | CC BY 
From 2006 to 2016, the population of Mexico increased by 14,997,685 people (a 14% growth), while Saint Kitts and Nevis gained 506 people (a 1.09% growth).
For the next 10 years, from 2016 to 2026, Mexico gained 11,300,215 people (a 9.24% growth), while Saint Kitts and Nevis' population decreased by 44 people (a 0.09% decline).
Mexico was ranked 11th most populous country in 2006 and is still 11th in 2026. Saint Kitts and Nevis was ranked 190th in 2006 and ranked 189th now.
The UN's World Population Prospects forecasts that in 24 years (in 2050) Mexico's population will grow by 11.9% to 149,423,583 people with a rank change from 11th to 12th. The population of Saint Kitts and Nevis will decrease by 5.58% to 44,409 people and will still be ranked 189th.
Mexico is projected to reach its peak in 2059 at 151M people, while Saint Kitts and Nevis' population already peaked in 1960 at 55.8K people and is projected to decrease to 30.4K people by 2100.
Population growth rate by year
| Year | Growth rate | |
|---|---|---|
|
Mexico
|
Saint Kitts
|
|
| 2100 | -0.58% | -0.8% |
| 2099 | -0.57% | -0.79% |
| 2098 | -0.57% | -0.77% |
| 2097 | -0.56% | -0.8% |
| 2096 | -0.55% | -0.8% |
| 2095 | -0.54% | -0.79% |
| 2094 | -0.53% | -0.79% |
| 2093 | -0.52% | -0.83% |
| 2092 | -0.51% | -0.79% |
| 2091 | -0.5% | -0.81% |
| 2090 | -0.49% | -0.81% |
| 2089 | -0.48% | -0.85% |
| 2088 | -0.47% | -0.8% |
| 2087 | -0.46% | -0.86% |
| 2086 | -0.45% | -0.81% |
| 2085 | -0.43% | -0.84% |
| 2084 | -0.41% | -0.85% |
| 2083 | -0.4% | -0.82% |
| 2082 | -0.39% | -0.85% |
| 2081 | -0.37% | -0.83% |
| 2080 | -0.36% | -0.84% |
| 2079 | -0.34% | -0.86% |
| 2078 | -0.32% | -0.83% |
| 2077 | -0.31% | -0.85% |
| 2076 | -0.29% | -0.83% |
| 2075 | -0.28% | -0.85% |
| 2074 | -0.26% | -0.78% |
| 2073 | -0.24% | -0.81% |
| 2072 | -0.22% | -0.8% |
| 2071 | -0.21% | -0.8% |
| 2070 | -0.19% | -0.76% |
| 2069 | -0.17% | -0.77% |
| 2068 | -0.16% | -0.76% |
| 2067 | -0.14% | -0.73% |
| 2066 | -0.12% | -0.73% |
| 2065 | -0.11% | -0.7% |
| 2064 | -0.09% | -0.67% |
| 2063 | -0.07% | -0.67% |
| 2062 | -0.05% | -0.64% |
| 2061 | -0.04% | -0.63% |
| 2060 | -0.01% | -0.67% |
| 2059 | 0.005% | -0.69% |
| 2058 | 0.02% | -0.67% |
| 2057 | 0.04% | -0.62% |
| 2056 | 0.06% | -0.66% |
| 2055 | 0.08% | -0.62% |
| 2054 | 0.1% | -0.62% |
| 2053 | 0.12% | -0.59% |
| 2052 | 0.15% | -0.58% |
| 2051 | 0.17% | -0.56% |
| 2050 | 0.19% | -0.49% |
| 2049 | 0.22% | -0.49% |
| 2048 | 0.24% | -0.52% |
| 2047 | 0.27% | -0.48% |
| 2046 | 0.29% | -0.48% |
| 2045 | 0.32% | -0.44% |
| 2044 | 0.34% | -0.47% |
| 2043 | 0.37% | -0.4% |
| 2042 | 0.4% | -0.35% |
| 2041 | 0.42% | -0.33% |
| 2040 | 0.45% | -0.32% |
| 2039 | 0.48% | -0.26% |
| 2038 | 0.5% | -0.24% |
| 2037 | 0.52% | -0.23% |
| 2036 | 0.55% | -0.21% |
| 2035 | 0.57% | -0.15% |
| 2034 | 0.6% | -0.08% |
| 2033 | 0.63% | -0.07% |
| 2032 | 0.65% | -0.03% |
| 2031 | 0.67% | 0.02% |
| 2030 | 0.7% | 0.05% |
| 2029 | 0.73% | 0.04% |
| 2028 | 0.75% | 0.13% |
| 2027 | 0.78% | 0.13% |
| 2026 | 0.81% | 0.16% |
| 2025 | 0.83% | 0.17% |
| 2024 | 0.86% | 0.18% |
| 2023 | 0.88% | 0.1% |
| 2022 | 0.76% | -0.12% |
| 2021 | 0.67% | -0.23% |
| 2020 | 0.82% | -0.17% |
| 2019 | 0.95% | -0.12% |
| 2018 | 0.95% | -0.09% |
| 2017 | 0.94% | -0.05% |
| 2016 | 0.97% | -0.03% |
| 2015 | 1.08% | -0.004% |
| 2014 | 1.22% | 0.04% |
| 2013 | 1.31% | 0.08% |
| 2012 | 1.37% | 0.31% |
| 2011 | 1.43% | 0.09% |
| 2010 | 1.45% | -0.15% |
| 2009 | 1.47% | 0.17% |
| 2008 | 1.47% | 0.28% |
| 2007 | 1.42% | 0.29% |
| 2006 | 1.36% | 0.28% |
| 2005 | 1.36% | 0.26% |
| 2004 | 1.37% | 0.3% |
| 2003 | 1.41% | 0.34% |
| 2002 | 1.45% | 0.57% |
| 2001 | 1.49% | 1.13% |
| 2000 | 1.55% | 1.45% |
| 1999 | 1.61% | 1.37% |
| 1998 | 1.65% | 1.31% |
| 1997 | 1.7% | 1.29% |
| 1996 | 1.75% | 1.3% |
| 1995 | 1.8% | 1.32% |
| 1994 | 1.83% | 1.29% |
| 1993 | 1.87% | 1.29% |
| 1992 | 1.91% | 0.88% |
| 1991 | 1.94% | -0.18% |
| 1990 | 1.94% | -0.8% |
| 1989 | 1.95% | -0.74% |
| 1988 | 2% | -0.69% |
| 1987 | 2.03% | -0.65% |
| 1986 | 2.06% | -0.61% |
| 1985 | 2.09% | -0.57% |
| 1984 | 2.13% | -0.52% |
| 1983 | 2.18% | -0.47% |
| 1982 | 2.24% | -0.39% |
| 1981 | 2.37% | -0.35% |
| 1980 | 2.52% | -0.43% |
| 1979 | 2.61% | -0.43% |
| 1978 | 2.68% | -0.33% |
| 1977 | 2.74% | -0.29% |
| 1976 | 2.82% | -0.28% |
| 1975 | 2.9% | -0.3% |
| 1974 | 2.97% | -0.32% |
| 1973 | 3.03% | -0.35% |
| 1972 | 3.09% | -0.39% |
| 1971 | 3.14% | -0.9% |
| 1970 | 3.21% | -2.46% |
| 1969 | 3.28% | -3.2% |
| 1968 | 3.34% | -2.8% |
| 1967 | 3.36% | -2.59% |
| 1966 | 3.37% | -2.43% |
| 1965 | 3.36% | -2.27% |
| 1964 | 3.33% | -2.09% |
| 1963 | 3.31% | -1.87% |
| 1962 | 3.27% | -1.58% |
| 1961 | 3.17% | -0.85% |
Data sources: United Nations | World Population Prospects (2026–2100, retrieved 2026-07-08); World Bank | Health (1961–2025, retrieved 2026-07-08).
GeoRank.org/population/mexico/saint-kitts-and-nevis | CC BY
In 2025, the population of Mexico grew by 0.83%, while Saint Kitts and Nevis' population grew by 0.17%.
Live population counters
|
Mexico
|
Saint Kitts
|
|
|---|---|---|
| Current population |
133551566
|
47031
|
| Population rank | 11/197 | 189/197 |
| Percent of world population | 1.61% | 0.0006% |
| One net population change |
29.1 seconds
|
4.63 days
|
| One birth every |
15.6 seconds
|
16 hours
|
| One death every |
38.8 seconds
|
18.8 hours
|
| Daily growth/decline | +2,975 | +0 |
| Annual growth/decline | +1,085,893 | +79 |
| Annual growth/decline rate | +0.83% | +0.17% |
| Population growth rate rank | 109/197 | 152/197 |
| One migration net change every |
4.88 minutes
|
2.9 weeks
|
| Annual migration change | -108,037 | +18 |
| Net migration rank | 181/196 | 75/196 |
| Foreign-born residents | 1,726,089 | 7,958 |
| Foreign-born residents rank | 42/195 | 181/195 |
| Foreign-born share of population | 1.3% | 17% |
| Foreign-born share rank | 149/195 | 37/195 |
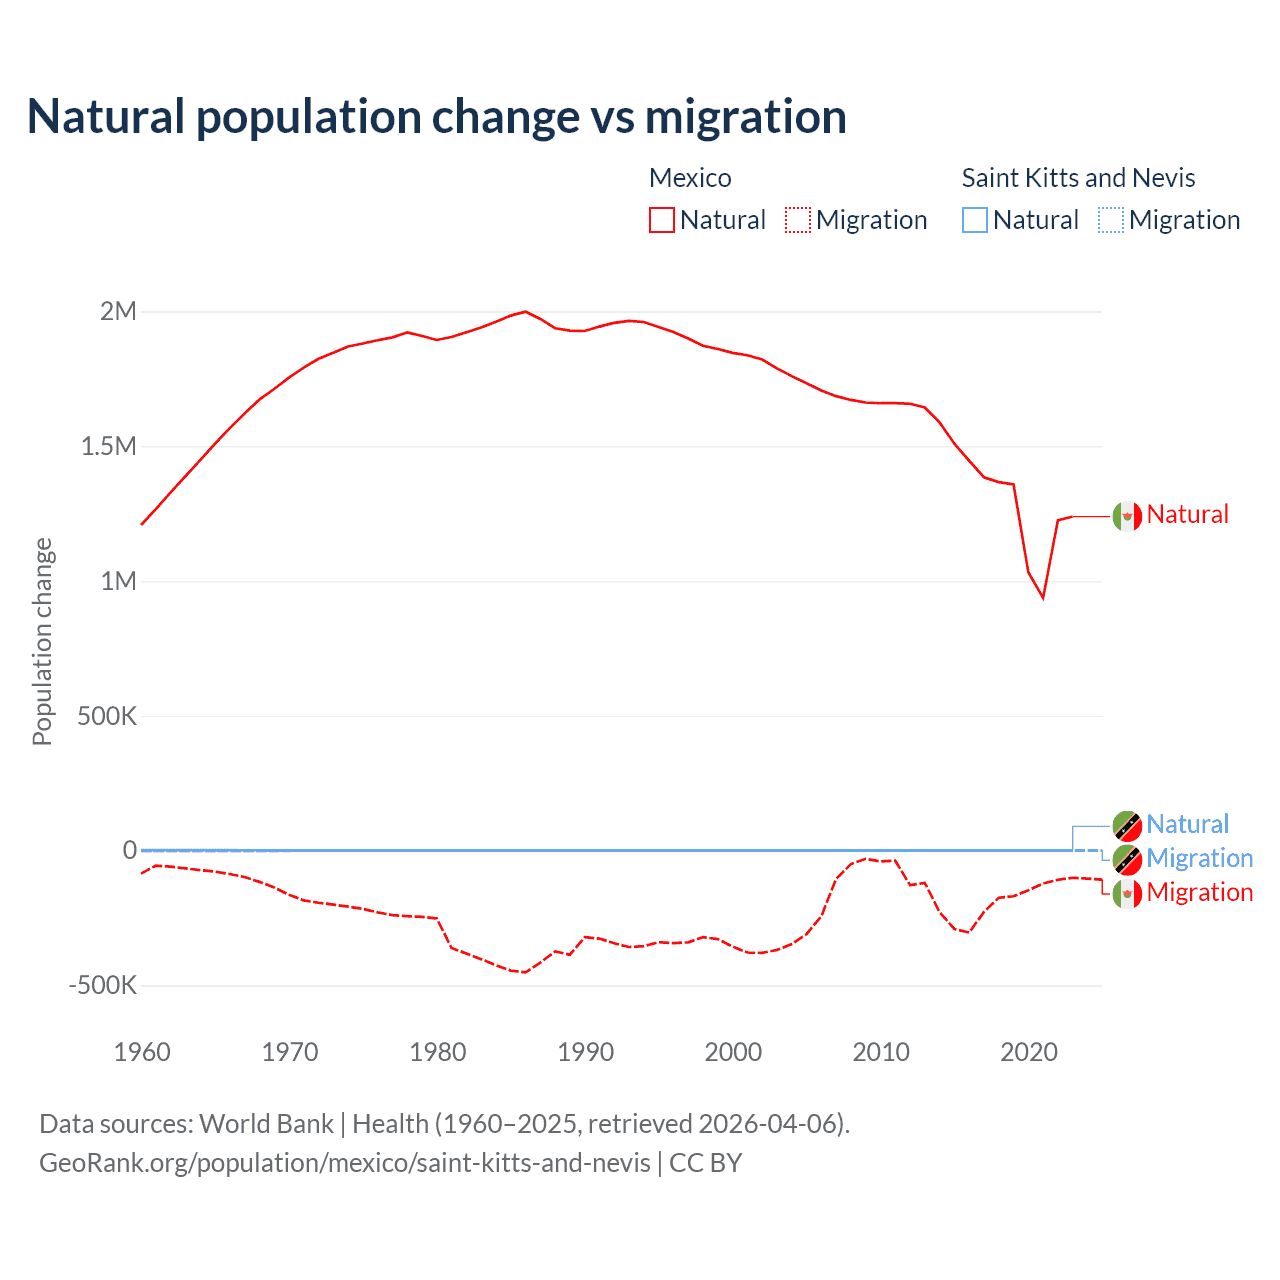
Natural population change vs migration
| Year | Population change | |||
|---|---|---|---|---|
|
Mexico
|
Saint Kitts
|
|||
| Natural | Migration | Natural | Migration | |
| 2025 | - | -108,037 | - | 18 |
| 2024 | 1,209,810 | -104,581 | 82 | -7 |
| 2023 | 1,238,366 | -101,044 | 84 | 0 |
| 2022 | 1,224,397 | -108,438 | 14 | 0 |
| 2021 | 936,682 | -122,791 | -20 | -92 |
| 2020 | 1,031,637 | -147,456 | 98 | -202 |
| 2019 | 1,357,485 | -169,628 | 135 | -202 |
| 2018 | 1,366,076 | -175,356 | 150 | -202 |
| 2017 | 1,384,178 | -227,499 | 169 | -202 |
| 2016 | 1,445,256 | -304,472 | 185 | -202 |
| 2015 | 1,508,439 | -291,044 | 197 | -202 |
| 2014 | 1,587,620 | -228,816 | 213 | -202 |
| 2013 | 1,642,609 | -120,058 | 227 | -202 |
| 2012 | 1,656,599 | -128,485 | 246 | -202 |
| 2011 | 1,659,161 | -37,826 | 250 | 0 |
| 2010 | 1,658,682 | -40,845 | 274 | -449 |
| 2009 | 1,661,180 | -30,809 | 300 | -263 |
| 2008 | 1,670,846 | -50,347 | 322 | -197 |
| 2007 | 1,684,915 | -105,524 | 341 | -200 |
| 2006 | 1,706,084 | -244,140 | 355 | -221 |
| 2005 | 1,732,663 | -310,278 | 361 | -234 |
| 2004 | 1,759,250 | -346,912 | 365 | -237 |
| 2003 | 1,788,016 | -369,183 | 369 | -224 |
| 2002 | 1,820,665 | -379,812 | 365 | -210 |
| 2001 | 1,836,418 | -378,348 | 369 | -7 |
| 2000 | 1,845,383 | -356,433 | 376 | 291 |
| 1999 | 1,859,475 | -328,773 | 413 | 213 |
| 1998 | 1,871,650 | -321,385 | 415 | 170 |
| 1997 | 1,898,383 | -340,546 | 405 | 157 |
| 1996 | 1,922,554 | -343,399 | 379 | 168 |
| 1995 | 1,941,458 | -340,091 | 382 | 162 |
| 1994 | 1,959,775 | -354,573 | 370 | 170 |
| 1993 | 1,963,708 | -358,039 | 373 | 160 |
| 1992 | 1,956,659 | -344,313 | 369 | 158 |
| 1991 | 1,942,832 | -326,691 | 411 | -217 |
| 1990 | 1,926,480 | -321,764 | 471 | -812 |
| 1989 | 1,927,752 | -386,467 | 476 | -788 |
| 1988 | 1,936,601 | -374,544 | 471 | -766 |
| 1987 | 1,971,231 | -415,521 | 486 | -767 |
| 1986 | 1,998,043 | -451,756 | 520 | -783 |
| 1985 | 1,983,622 | -445,447 | 574 | -821 |
| 1984 | 1,960,428 | -425,467 | 598 | -828 |
| 1983 | 1,939,193 | -402,937 | 664 | -880 |
| 1982 | 1,921,772 | -382,048 | 672 | -858 |
| 1981 | 1,904,384 | -361,791 | 684 | -832 |
| 1980 | 1,893,158 | -252,177 | 652 | -798 |
| 1979 | 1,908,018 | -246,034 | 643 | -856 |
| 1978 | 1,921,419 | -243,714 | 654 | -817 |
| 1977 | 1,902,964 | -239,521 | 697 | -820 |
| 1976 | 1,891,958 | -229,450 | 703 | -823 |
| 1975 | 1,880,241 | -216,556 | 688 | -813 |
| 1974 | 1,868,809 | -207,995 | 670 | -810 |
| 1973 | 1,845,593 | -200,688 | 646 | -794 |
| 1972 | 1,823,302 | -193,965 | 619 | -782 |
| 1971 | 1,790,990 | -185,062 | 615 | -797 |
| 1970 | 1,753,370 | -164,100 | 611 | -1,227 |
| 1969 | 1,711,297 | -137,051 | 708 | -2,340 |
| 1968 | 1,671,918 | -116,358 | 812 | -2,208 |
| 1967 | 1,620,534 | -98,680 | 951 | -2,270 |
| 1966 | 1,566,170 | -87,018 | 1,103 | -2,366 |
| 1965 | 1,508,344 | -78,288 | 1,228 | -2,447 |
| 1964 | 1,447,360 | -72,581 | 1,305 | -2,465 |
| 1963 | 1,387,678 | -66,515 | 1,360 | -2,435 |
| 1962 | 1,328,319 | -59,833 | 1,373 | -2,331 |
| 1961 | 1,265,833 | -56,174 | 1,466 | -2,256 |
| 1960 | 1,206,955 | -85,591 | 1,562 | -1,725 |
Data sources: World Bank | Health (1960–2025, retrieved 2026-07-08).
GeoRank.org/population/mexico/saint-kitts-and-nevis | CC BY
Over the last 10 years, 87.9% of the population change in Mexico is from natural causes (a gain of 12,702,326 people) and 12.1% is from migration (a loss of 1,752,309 people). In Saint Kitts and Nevis 45.5% is from natural causes (a gain of 1,094 people) and 54.5% is from migration (a loss of 1,311 people).
As of 2024, 1,726,089 residents or 1.3% of the population were not native-born in Mexico, compared to 7,958 people or 17% in Saint Kitts and Nevis.
Biggest cities by population
|
Mexico
|
|
|---|---|
| City | Population |
| Mexico | 9.21M |
| Veracruz | 8.06M |
| San Luis Potosi | 2.82M |
| Tijuana | 1.96M |
| Leon | 1.58M |
| Puebla | 1.43M |
| Guadalajara | 1.39M |
| Ciudad Juarez | 1.32M |
| Zapopan | 1.26M |
| Monterrey | 1.14M |
|
Saint Kitts
|
|
|---|---|
| City | Population |
| Basseterre | 12.9K |
| Cayon | 3K |
Compare countries by 7 more topics
Population differences between Mexico and Saint Kitts and Nevis
|
Mexico
|
Saint Kitts
|
|
|---|---|---|
| Life expectancy | 75.6 years | 72.6 years |
| Average age | 33 years | 37.5 years |
| Median age | 30.6 years | 37.1 years |
| Male:Female ratio | 48.5:51.5 | 47.8:52.2 |
| Fertility rate | 1.89 births per woman | 1.53 births per woman |
| Population density | 177.2 ppl/mi² | 468 ppl/mi² |
Population map with other countries
Data sources: World Bank | Health (1960–2025, retrieved 2026-07-08); United Nations | World Population Prospects (1960–2026, retrieved 2026-07-08); U.S. Census Bureau (1960–2025, retrieved 2026-07-08); Central Intelligence Agency (CIA) (2000–2019, retrieved 2026-07-08).
GeoRank.org/population/mexico/saint-kitts-and-nevis | CC BY
Help us show the world through your eyes
Share a photo of your city and help others discover what it looks like to live there. Your contribution makes our data come alive.
Data sources:
- World Bank | Health (1960–2025, retrieved 2026-07-08)
- United Nations | World Population Prospects (1960–2100, retrieved 2026-07-08)
- U.S. Census Bureau (1960–2025, retrieved 2026-07-08)
- Central Intelligence Agency (CIA) (2000–2019, retrieved 2026-07-08)
- Wikidata (2026, retrieved 2026-07-08)
Creative Commons Attribution (CC BY) — you’re free to copy, share, remix, adapt, and use even commercially as long as you give appropriate credit and clearly indicate if you made changes. Other sources may be subject to different license terms.