The latest officially reported population of Saint Lucia was 180,149 in 2025 vs 101,598,527 people in Vietnam in 2025. In 2026, based on the adjusted UN estimation, the current Saint Lucia's population is 180,676 people compared to 102,486,146 in Vietnam.
Population statistics:
- Vietnam's population is 567 times bigger than Saint Lucia's.
- Saint Lucia is ranked the 178th most populous country in the world, while Vietnam is the 16th.
- The countries together account for 1.24% of the world: 0.002% for Saint Lucia vs 1.23% for Vietnam.
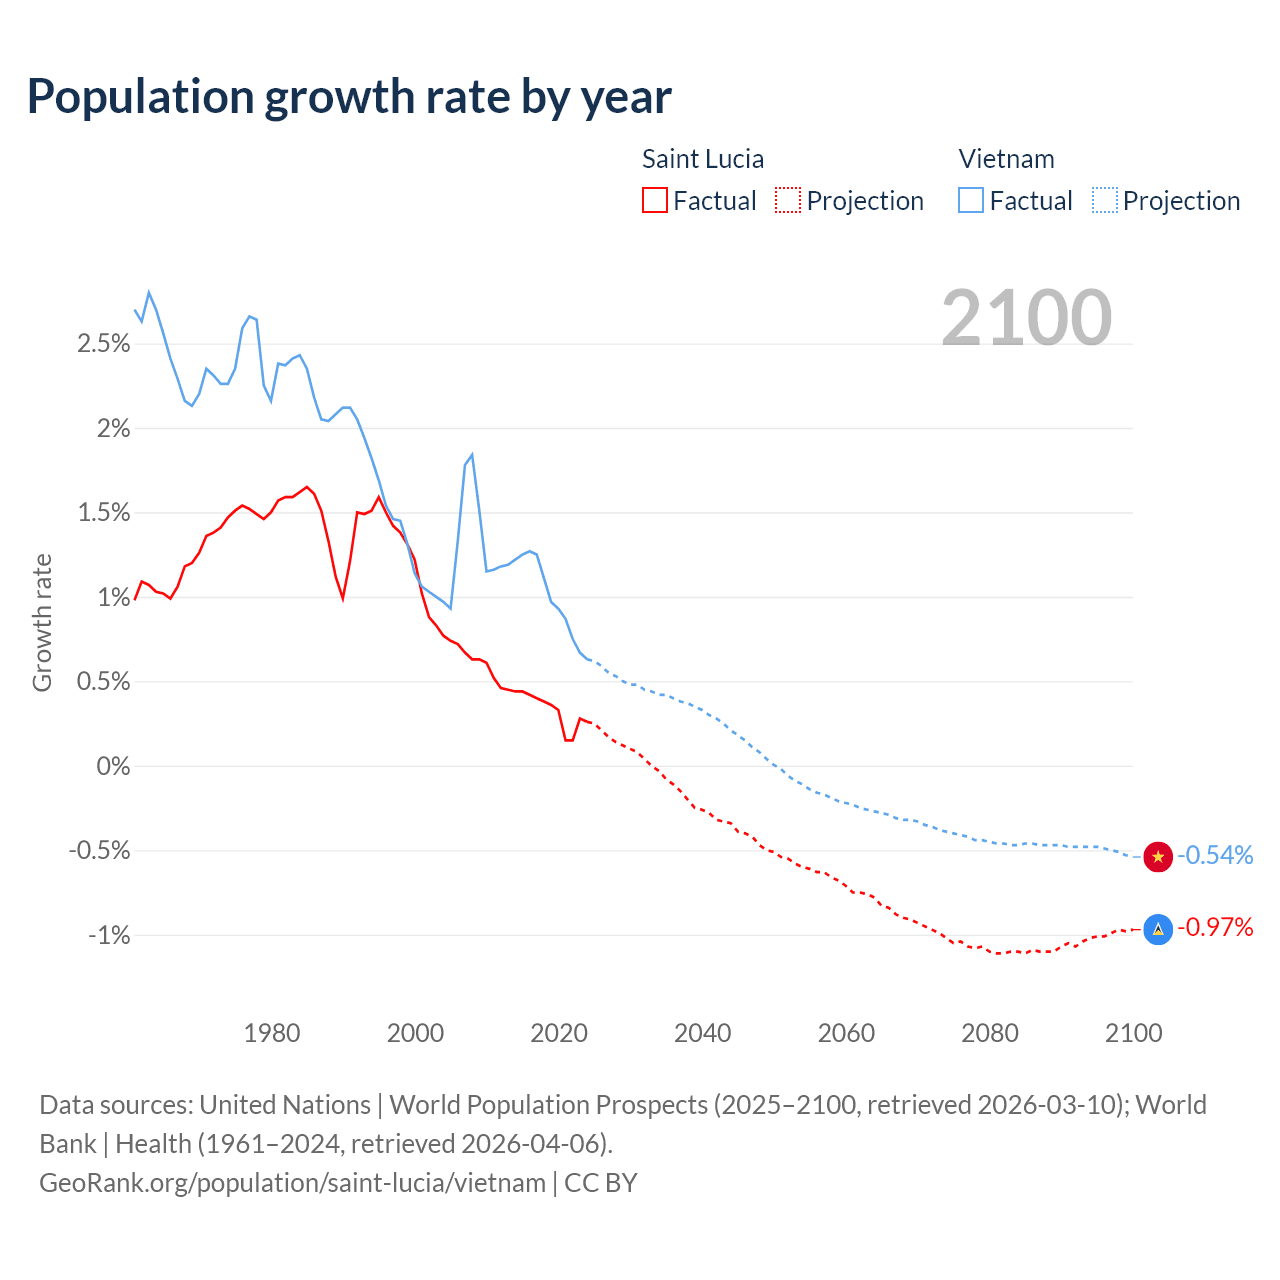
- For the last 10 years, Saint Lucia has had an average growth rate of +0.31% per year vs +0.94% in Vietnam.
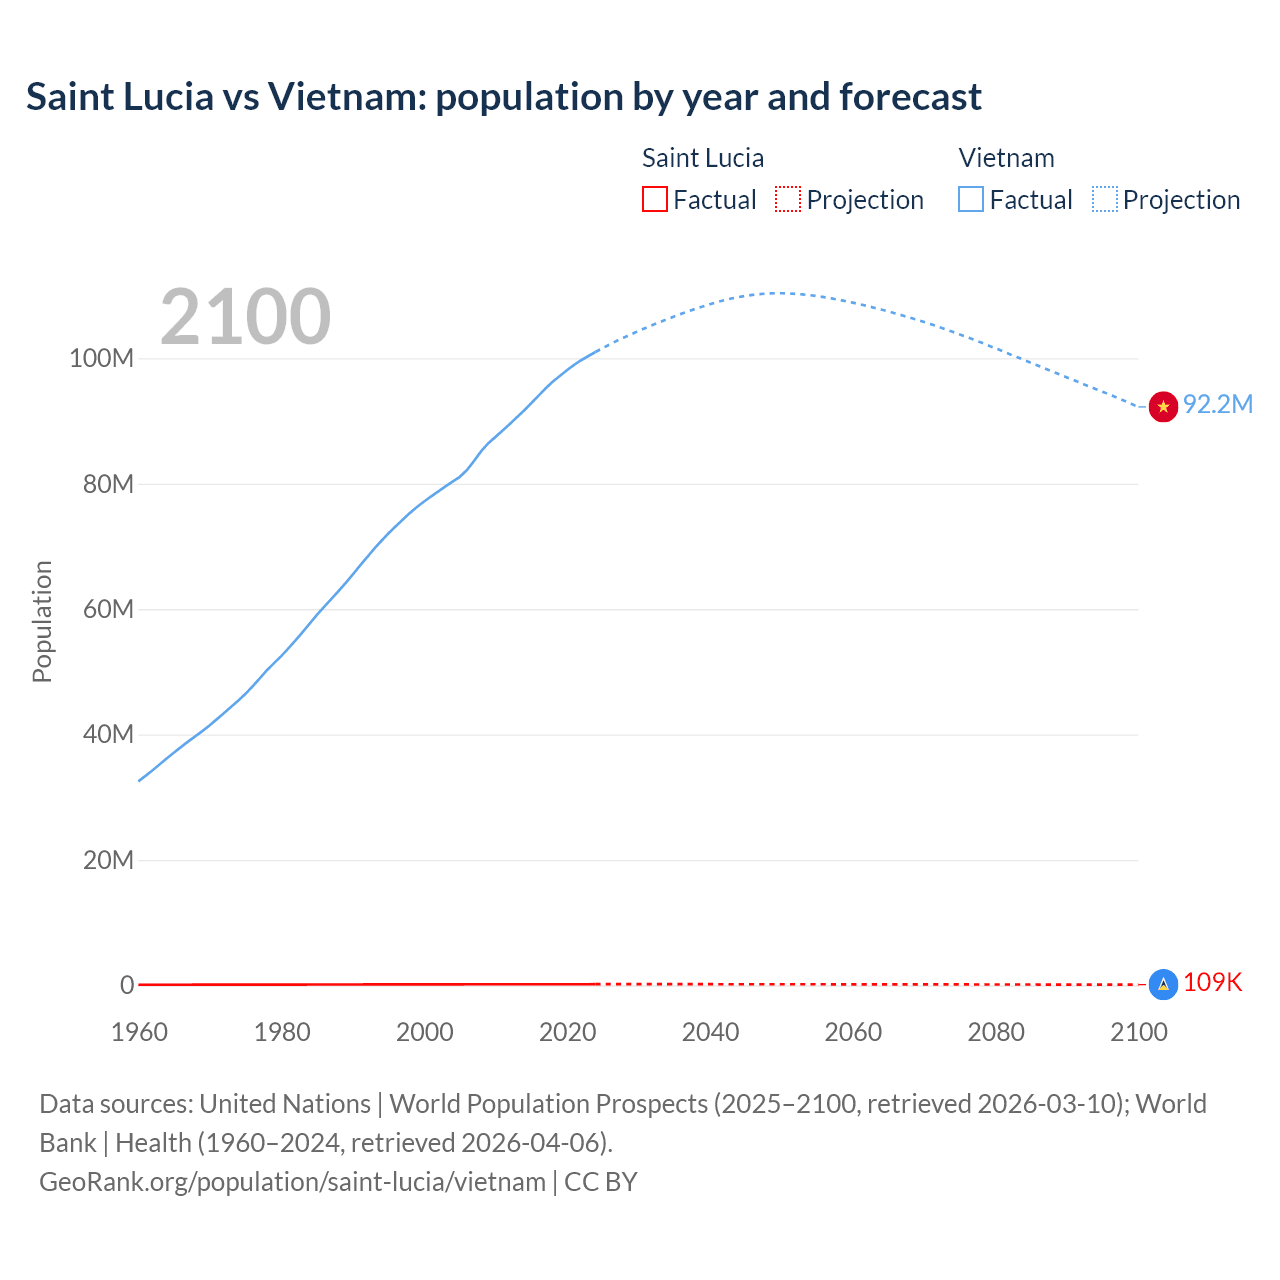
- Since 2006, the population of Saint Lucia has increased from 167K people to 181K (8.42% growth), while Vietnam has grown from 82.2M to 102M (24.7% growth).
Saint Lucia vs Vietnam: population by year and forecast
| Year | Population | |
|---|---|---|
 Saint Lucia
|
 Vietnam
|
|
| 2100 | 108,837 | 92,225,380 |
| 2099 | 109,902 | 92,721,469 |
| 2098 | 110,987 | 93,212,742 |
| 2097 | 112,079 | 93,688,693 |
| 2096 | 113,197 | 94,163,950 |
| 2095 | 114,352 | 94,626,063 |
| 2094 | 115,520 | 95,083,879 |
| 2093 | 116,712 | 95,543,293 |
| 2092 | 117,943 | 96,000,019 |
| 2091 | 119,217 | 96,459,165 |
| 2090 | 120,487 | 96,922,871 |
| 2089 | 121,795 | 97,384,434 |
| 2088 | 123,153 | 97,843,001 |
| 2087 | 124,518 | 98,308,755 |
| 2086 | 125,900 | 98,773,008 |
| 2085 | 127,292 | 99,233,927 |
| 2084 | 128,725 | 99,695,401 |
| 2083 | 130,153 | 100,162,677 |
| 2082 | 131,599 | 100,634,653 |
| 2081 | 133,075 | 101,104,469 |
| 2080 | 134,563 | 101,568,526 |
| 2079 | 136,058 | 102,030,723 |
| 2078 | 137,536 | 102,480,219 |
| 2077 | 139,033 | 102,928,253 |
| 2076 | 140,538 | 103,358,352 |
| 2075 | 142,015 | 103,783,177 |
| 2074 | 143,519 | 104,197,814 |
| 2073 | 144,999 | 104,606,950 |
| 2072 | 146,447 | 105,005,673 |
| 2071 | 147,876 | 105,384,777 |
| 2070 | 149,289 | 105,757,144 |
| 2069 | 150,694 | 106,110,195 |
| 2068 | 152,083 | 106,454,379 |
| 2067 | 153,458 | 106,794,625 |
| 2066 | 154,825 | 107,126,965 |
| 2065 | 156,135 | 107,442,675 |
| 2064 | 157,438 | 107,744,261 |
| 2063 | 158,683 | 108,038,461 |
| 2062 | 159,905 | 108,322,712 |
| 2061 | 161,106 | 108,590,617 |
| 2060 | 162,327 | 108,842,045 |
| 2059 | 163,483 | 109,087,333 |
| 2058 | 164,600 | 109,320,301 |
| 2057 | 165,696 | 109,529,799 |
| 2056 | 166,752 | 109,715,196 |
| 2055 | 167,809 | 109,886,647 |
| 2054 | 168,844 | 110,035,740 |
| 2053 | 169,865 | 110,156,643 |
| 2052 | 170,854 | 110,253,026 |
| 2051 | 171,791 | 110,321,289 |
| 2050 | 172,723 | 110,344,733 |
| 2049 | 173,613 | 110,339,565 |
| 2048 | 174,493 | 110,296,602 |
| 2047 | 175,320 | 110,211,618 |
| 2046 | 176,064 | 110,090,837 |
| 2045 | 176,768 | 109,926,260 |
| 2044 | 177,462 | 109,731,512 |
| 2043 | 178,075 | 109,497,595 |
| 2042 | 178,659 | 109,225,525 |
| 2041 | 179,227 | 108,919,674 |
| 2040 | 179,727 | 108,594,542 |
| 2039 | 180,191 | 108,237,715 |
| 2038 | 180,634 | 107,861,117 |
| 2037 | 181,001 | 107,463,482 |
| 2036 | 181,267 | 107,058,359 |
| 2035 | 181,460 | 106,630,705 |
| 2034 | 181,613 | 106,189,495 |
| 2033 | 181,676 | 105,745,684 |
| 2032 | 181,680 | 105,283,013 |
| 2031 | 181,614 | 104,809,957 |
| 2030 | 181,477 | 104,314,150 |
| 2029 | 181,299 | 103,819,556 |
| 2028 | 181,079 | 103,300,347 |
| 2027 | 180,826 | 102,759,746 |
| 2026 | 180,519 | 102,197,177 |
| 2025 | 180,149 | 101,598,527 |
| 2024 | 179,744 | 100,987,686 |
| 2023 | 179,285 | 100,352,192 |
| 2022 | 178,781 | 99,680,655 |
| 2021 | 178,522 | 98,935,098 |
| 2020 | 178,250 | 98,079,191 |
| 2019 | 177,661 | 97,173,776 |
| 2018 | 177,017 | 96,237,319 |
| 2017 | 176,342 | 95,176,977 |
| 2016 | 175,646 | 94,000,117 |
| 2015 | 174,905 | 92,823,254 |
| 2014 | 174,138 | 91,679,578 |
| 2013 | 173,369 | 90,573,104 |
| 2012 | 172,587 | 89,510,356 |
| 2011 | 171,801 | 88,468,314 |
| 2010 | 170,906 | 87,455,152 |
| 2009 | 169,869 | 86,460,018 |
| 2008 | 168,808 | 85,175,788 |
| 2007 | 167,758 | 83,633,375 |
| 2006 | 166,639 | 82,167,897 |
| 2005 | 165,450 | 81,088,313 |
| 2004 | 164,239 | 80,338,971 |
| 2003 | 162,976 | 79,563,777 |
| 2002 | 161,641 | 78,772,224 |
| 2001 | 160,237 | 77,969,361 |
| 2000 | 158,616 | 77,154,011 |
| 1999 | 156,702 | 76,287,452 |
| 1998 | 154,677 | 75,299,660 |
| 1997 | 152,569 | 74,226,889 |
| 1996 | 150,436 | 73,156,447 |
| 1995 | 148,208 | 72,049,940 |
| 1994 | 145,890 | 70,854,391 |
| 1993 | 143,726 | 69,586,384 |
| 1992 | 141,617 | 68,260,337 |
| 1991 | 139,520 | 66,891,775 |
| 1990 | 137,857 | 65,504,552 |
| 1989 | 136,512 | 64,147,348 |
| 1988 | 135,000 | 62,843,228 |
| 1987 | 133,227 | 61,584,651 |
| 1986 | 131,239 | 60,347,048 |
| 1985 | 129,159 | 59,060,622 |
| 1984 | 127,067 | 57,706,067 |
| 1983 | 125,044 | 56,337,921 |
| 1982 | 123,087 | 55,011,289 |
| 1981 | 121,166 | 53,738,141 |
| 1980 | 119,290 | 52,490,101 |
| 1979 | 117,528 | 51,378,211 |
| 1978 | 115,834 | 50,249,552 |
| 1977 | 114,135 | 48,954,872 |
| 1976 | 112,425 | 47,684,931 |
| 1975 | 110,725 | 46,482,903 |
| 1974 | 109,076 | 45,413,537 |
| 1973 | 107,498 | 44,409,861 |
| 1972 | 106,002 | 43,429,168 |
| 1971 | 104,564 | 42,449,276 |
| 1970 | 103,165 | 41,475,230 |
| 1969 | 101,879 | 40,582,096 |
| 1968 | 100,675 | 39,734,609 |
| 1967 | 99,504 | 38,895,080 |
| 1966 | 98,463 | 38,024,836 |
| 1965 | 97,493 | 37,129,656 |
| 1964 | 96,505 | 36,201,563 |
| 1963 | 95,519 | 35,249,101 |
| 1962 | 94,505 | 34,288,560 |
| 1961 | 93,490 | 33,409,059 |
| 1960 | 92,585 | 32,531,933 |
Data sources: United Nations | World Population Prospects (2026–2100, retrieved 2026-07-08); World Bank | Health (1960–2025, retrieved 2026-07-08).
GeoRank.org/population/saint-lucia/vietnam | CC BY 
From 2006 to 2016, the population of Saint Lucia increased by 9,007 people (a 5.41% growth), while Vietnam gained 11,832,220 people (a 14.4% growth).
For the next 10 years, from 2016 to 2026, Saint Lucia gained 5,030 people (a 2.86% growth), while Vietnam's population increased by 8,486,029 people (a 9.03% growth).
Saint Lucia was ranked 177th most populous country in 2006 and is 178th in 2026. Vietnam was ranked 15th in 2006 and ranked 16th now.
The UN's World Population Prospects forecasts that in 24 years (in 2050) Saint Lucia's population will shrink by 4.4% to 172,723 people with a rank change from 178th to 179th. The population of Vietnam will increase by 7.67% to 110,344,733 people and will still be ranked 16th.
Saint Lucia is projected to reach its peak in 2032 at 182K people compared to the peak of 110M people in 2050 for Vietnam.
Population growth rate by year
| Year | Growth rate | |
|---|---|---|
|
Saint Lucia
|
Vietnam
|
|
| 2100 | -0.97% | -0.54% |
| 2099 | -0.98% | -0.53% |
| 2098 | -0.97% | -0.51% |
| 2097 | -0.99% | -0.5% |
| 2096 | -1.01% | -0.49% |
| 2095 | -1.01% | -0.48% |
| 2094 | -1.02% | -0.48% |
| 2093 | -1.04% | -0.48% |
| 2092 | -1.07% | -0.48% |
| 2091 | -1.05% | -0.48% |
| 2090 | -1.07% | -0.47% |
| 2089 | -1.1% | -0.47% |
| 2088 | -1.1% | -0.47% |
| 2087 | -1.1% | -0.47% |
| 2086 | -1.09% | -0.46% |
| 2085 | -1.11% | -0.46% |
| 2084 | -1.1% | -0.47% |
| 2083 | -1.1% | -0.47% |
| 2082 | -1.11% | -0.46% |
| 2081 | -1.11% | -0.46% |
| 2080 | -1.1% | -0.45% |
| 2079 | -1.07% | -0.44% |
| 2078 | -1.08% | -0.44% |
| 2077 | -1.07% | -0.42% |
| 2076 | -1.04% | -0.41% |
| 2075 | -1.05% | -0.4% |
| 2074 | -1.02% | -0.39% |
| 2073 | -0.99% | -0.38% |
| 2072 | -0.97% | -0.36% |
| 2071 | -0.95% | -0.35% |
| 2070 | -0.93% | -0.33% |
| 2069 | -0.91% | -0.32% |
| 2068 | -0.9% | -0.32% |
| 2067 | -0.88% | -0.31% |
| 2066 | -0.84% | -0.29% |
| 2065 | -0.83% | -0.28% |
| 2064 | -0.78% | -0.27% |
| 2063 | -0.76% | -0.26% |
| 2062 | -0.75% | -0.25% |
| 2061 | -0.75% | -0.23% |
| 2060 | -0.71% | -0.22% |
| 2059 | -0.68% | -0.21% |
| 2058 | -0.66% | -0.19% |
| 2057 | -0.63% | -0.17% |
| 2056 | -0.63% | -0.16% |
| 2055 | -0.61% | -0.14% |
| 2054 | -0.6% | -0.11% |
| 2053 | -0.58% | -0.09% |
| 2052 | -0.55% | -0.06% |
| 2051 | -0.54% | -0.02% |
| 2050 | -0.51% | 0.005% |
| 2049 | -0.5% | 0.04% |
| 2048 | -0.47% | 0.08% |
| 2047 | -0.42% | 0.11% |
| 2046 | -0.4% | 0.15% |
| 2045 | -0.39% | 0.18% |
| 2044 | -0.34% | 0.21% |
| 2043 | -0.33% | 0.25% |
| 2042 | -0.32% | 0.28% |
| 2041 | -0.28% | 0.3% |
| 2040 | -0.26% | 0.33% |
| 2039 | -0.25% | 0.35% |
| 2038 | -0.2% | 0.37% |
| 2037 | -0.15% | 0.38% |
| 2036 | -0.11% | 0.4% |
| 2035 | -0.08% | 0.42% |
| 2034 | -0.03% | 0.42% |
| 2033 | -0.002% | 0.44% |
| 2032 | 0.04% | 0.45% |
| 2031 | 0.08% | 0.48% |
| 2030 | 0.1% | 0.48% |
| 2029 | 0.12% | 0.5% |
| 2028 | 0.14% | 0.53% |
| 2027 | 0.17% | 0.55% |
| 2026 | 0.21% | 0.59% |
| 2025 | 0.23% | 0.6% |
| 2024 | 0.26% | 0.63% |
| 2023 | 0.28% | 0.67% |
| 2022 | 0.15% | 0.75% |
| 2021 | 0.15% | 0.87% |
| 2020 | 0.33% | 0.93% |
| 2019 | 0.36% | 0.97% |
| 2018 | 0.38% | 1.11% |
| 2017 | 0.4% | 1.25% |
| 2016 | 0.42% | 1.27% |
| 2015 | 0.44% | 1.25% |
| 2014 | 0.44% | 1.22% |
| 2013 | 0.45% | 1.19% |
| 2012 | 0.46% | 1.18% |
| 2011 | 0.52% | 1.16% |
| 2010 | 0.61% | 1.15% |
| 2009 | 0.63% | 1.51% |
| 2008 | 0.63% | 1.84% |
| 2007 | 0.67% | 1.78% |
| 2006 | 0.72% | 1.33% |
| 2005 | 0.74% | 0.93% |
| 2004 | 0.77% | 0.97% |
| 2003 | 0.83% | 1% |
| 2002 | 0.88% | 1.03% |
| 2001 | 1.02% | 1.06% |
| 2000 | 1.22% | 1.14% |
| 1999 | 1.31% | 1.31% |
| 1998 | 1.38% | 1.45% |
| 1997 | 1.42% | 1.46% |
| 1996 | 1.5% | 1.54% |
| 1995 | 1.59% | 1.69% |
| 1994 | 1.51% | 1.82% |
| 1993 | 1.49% | 1.94% |
| 1992 | 1.5% | 2.05% |
| 1991 | 1.21% | 2.12% |
| 1990 | 0.99% | 2.12% |
| 1989 | 1.12% | 2.08% |
| 1988 | 1.33% | 2.04% |
| 1987 | 1.51% | 2.05% |
| 1986 | 1.61% | 2.18% |
| 1985 | 1.65% | 2.35% |
| 1984 | 1.62% | 2.43% |
| 1983 | 1.59% | 2.41% |
| 1982 | 1.59% | 2.37% |
| 1981 | 1.57% | 2.38% |
| 1980 | 1.5% | 2.16% |
| 1979 | 1.46% | 2.25% |
| 1978 | 1.49% | 2.64% |
| 1977 | 1.52% | 2.66% |
| 1976 | 1.54% | 2.59% |
| 1975 | 1.51% | 2.35% |
| 1974 | 1.47% | 2.26% |
| 1973 | 1.41% | 2.26% |
| 1972 | 1.38% | 2.31% |
| 1971 | 1.36% | 2.35% |
| 1970 | 1.26% | 2.2% |
| 1969 | 1.2% | 2.13% |
| 1968 | 1.18% | 2.16% |
| 1967 | 1.06% | 2.29% |
| 1966 | 0.99% | 2.41% |
| 1965 | 1.02% | 2.56% |
| 1964 | 1.03% | 2.7% |
| 1963 | 1.07% | 2.8% |
| 1962 | 1.09% | 2.63% |
| 1961 | 0.98% | 2.7% |
Data sources: United Nations | World Population Prospects (2026–2100, retrieved 2026-07-08); World Bank | Health (1961–2025, retrieved 2026-07-08).
GeoRank.org/population/saint-lucia/vietnam | CC BY
In 2025, the population of Saint Lucia grew by 0.23%, while Vietnam's population grew by 0.6%.
Live population counters
|
Saint Lucia
|
Vietnam
|
|
|---|---|---|
| Current population |
180676
|
102486146
|
| Population rank | 178/197 | 16/197 |
| Percent of world population | 0.002% | 1.23% |
| One net population change |
21.7 hours
|
51.8 seconds
|
| One birth every |
4.35 hours
|
23.3 seconds
|
| One death every |
5.6 hours
|
47 seconds
|
| Daily growth/decline | +1 | +1,674 |
| Annual growth/decline | +405 | +610,841 |
| Annual growth/decline rate | +0.23% | +0.6% |
| Population growth rate rank | 150/197 | 122/197 |
| One migration net change every |
2.27 weeks
|
10.9 minutes
|
| Annual migration change | -23 | -48,171 |
| Net migration rank | 79/196 | 174/196 |
| Foreign-born residents | 8,079 | 326,418 |
| Foreign-born residents rank | 180/195 | 95/195 |
| Foreign-born share of population | 4.5% | 0.3% |
| Foreign-born share rank | 98/195 | 185/195 |
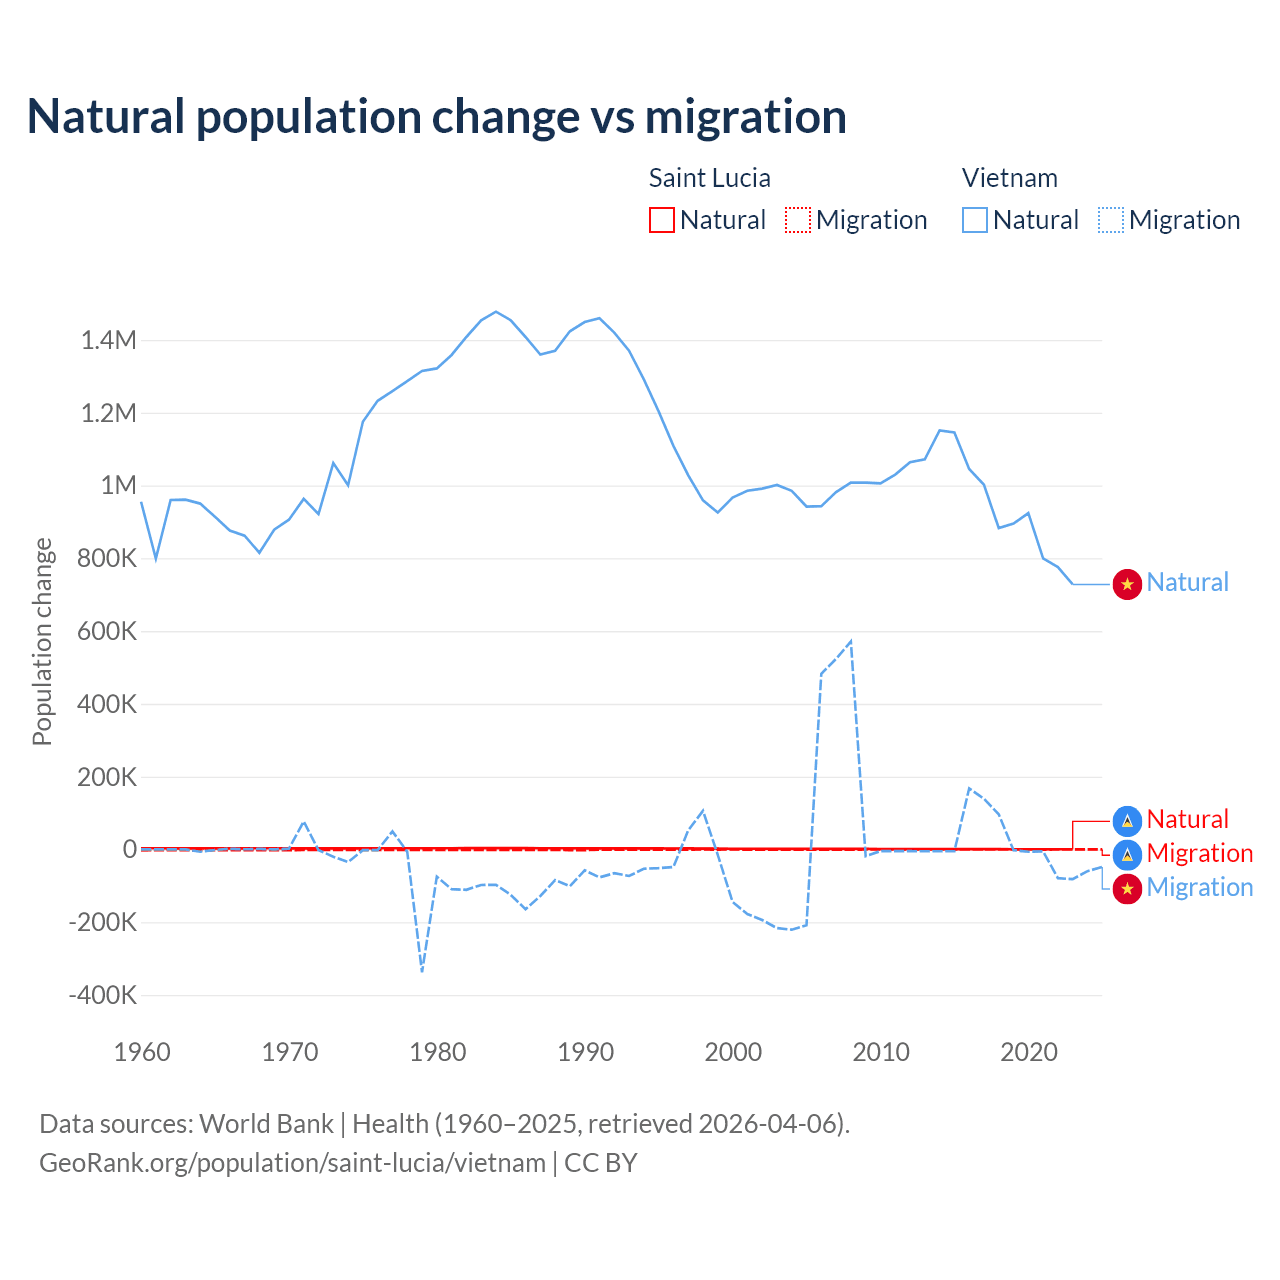
Natural population change vs migration
| Year | Population change | |||
|---|---|---|---|---|
|
Saint Lucia
|
Vietnam
|
|||
| Natural | Migration | Natural | Migration | |
| 2025 | - | -23 | - | -48,171 |
| 2024 | 449 | -7 | 684,393 | -59,645 |
| 2023 | 475 | 0 | 727,955 | -81,789 |
| 2022 | 530 | 0 | 775,914 | -78,977 |
| 2021 | -15 | 0 | 799,593 | -5,418 |
| 2020 | 562 | 0 | 924,004 | -6,457 |
| 2019 | 609 | 0 | 895,262 | -2,051 |
| 2018 | 694 | -18 | 882,977 | 96,650 |
| 2017 | 724 | -38 | 1,001,833 | 139,245 |
| 2016 | 767 | -57 | 1,045,094 | 167,652 |
| 2015 | 841 | -69 | 1,145,903 | -4,888 |
| 2014 | 852 | -90 | 1,151,221 | -4,894 |
| 2013 | 892 | -114 | 1,071,570 | -4,979 |
| 2012 | 916 | -135 | 1,063,741 | -4,851 |
| 2011 | 934 | -150 | 1,029,859 | -4,602 |
| 2010 | 1,176 | -170 | 1,005,559 | -4,443 |
| 2009 | 1,349 | -276 | 1,007,778 | -18,560 |
| 2008 | 1,369 | -331 | 1,008,141 | 571,113 |
| 2007 | 1,422 | -352 | 981,689 | 523,784 |
| 2006 | 1,511 | -339 | 943,041 | 482,399 |
| 2005 | 1,553 | -358 | 942,084 | -208,337 |
| 2004 | 1,615 | -378 | 985,438 | -220,458 |
| 2003 | 1,694 | -397 | 1,001,470 | -216,062 |
| 2002 | 1,774 | -409 | 991,427 | -193,766 |
| 2001 | 1,860 | -416 | 985,610 | -177,586 |
| 2000 | 1,967 | -176 | 966,894 | -144,298 |
| 1999 | 2,389 | -361 | 925,519 | -15,010 |
| 1998 | 2,294 | -268 | 959,016 | 106,091 |
| 1997 | 2,709 | -519 | 1,028,116 | 52,382 |
| 1996 | 2,649 | -571 | 1,108,686 | -48,235 |
| 1995 | 3,019 | -638 | 1,203,666 | -51,147 |
| 1994 | 2,976 | -721 | 1,291,534 | -53,012 |
| 1993 | 2,899 | -824 | 1,370,365 | -72,931 |
| 1992 | 2,981 | -834 | 1,419,952 | -65,285 |
| 1991 | 3,009 | -963 | 1,459,311 | -76,829 |
| 1990 | 3,061 | -1,790 | 1,449,157 | -57,221 |
| 1989 | 3,146 | -1,734 | 1,423,622 | -101,113 |
| 1988 | 3,229 | -1,606 | 1,370,108 | -84,361 |
| 1987 | 3,351 | -1,423 | 1,359,481 | -128,095 |
| 1986 | 3,496 | -1,453 | 1,407,957 | -164,183 |
| 1985 | 3,591 | -1,465 | 1,453,954 | -124,910 |
| 1984 | 3,526 | -1,468 | 1,477,448 | -97,339 |
| 1983 | 3,443 | -1,462 | 1,453,913 | -97,706 |
| 1982 | 3,360 | -1,423 | 1,407,959 | -110,901 |
| 1981 | 3,306 | -1,403 | 1,358,500 | -109,259 |
| 1980 | 3,275 | -1,422 | 1,321,595 | -74,791 |
| 1979 | 3,301 | -1,625 | 1,314,563 | -337,597 |
| 1978 | 3,340 | -1,635 | 1,286,991 | -6,592 |
| 1977 | 3,240 | -1,543 | 1,259,315 | 49,655 |
| 1976 | 3,166 | -1,444 | 1,232,608 | -1,733 |
| 1975 | 3,126 | -1,454 | 1,175,181 | -2,010 |
| 1974 | 3,106 | -1,472 | 1,000,505 | -34,940 |
| 1973 | 3,033 | -1,513 | 1,061,707 | -19,937 |
| 1972 | 3,028 | -1,566 | 921,524 | -1,920 |
| 1971 | 3,046 | -1,625 | 963,259 | 76,961 |
| 1970 | 3,093 | -1,709 | 905,902 | 1,997 |
| 1969 | 3,143 | -1,954 | 878,359 | 0 |
| 1968 | 3,154 | -1,937 | 815,116 | 1,489 |
| 1967 | 3,113 | -1,997 | 862,071 | 394 |
| 1966 | 3,028 | -2,065 | 876,283 | 1,769 |
| 1965 | 3,042 | -2,067 | 913,761 | -1,438 |
| 1964 | 3,074 | -2,079 | 950,219 | -6,328 |
| 1963 | 3,048 | -2,060 | 961,067 | 0 |
| 1962 | 3,124 | -2,082 | 960,046 | 0 |
| 1961 | 3,173 | -2,189 | 798,978 | 0 |
| 1960 | 3,202 | -2,366 | 955,268 | 0 |
Data sources: World Bank | Health (1960–2025, retrieved 2026-07-08).
GeoRank.org/population/saint-lucia/vietnam | CC BY
Over the last 10 years, 96.8% of the population change in Saint Lucia is from natural causes (a gain of 5,636 people) and 3.24% is from migration (a loss of 189 people). In Vietnam 98.2% is from natural causes (a gain of 8,882,928 people) and 1.82% is from migration (a gain of 164,322 people).
As of 2024, 8,079 residents or 4.5% of the population were not native-born in Saint Lucia, compared to 326,418 people or 0.3% in Vietnam.
Biggest cities by population
|
Saint Lucia
|
|
|---|---|
| City | Population |
| Castries | 20K |
| Vieux Fort | 15.8K |
|
Vietnam
|
|
|---|---|
| City | Population |
| Ho Chi Minh | 14M |
| Hanoi | 8.72M |
| Can Tho | 3.21M |
| Da Nang | 2.82M |
| Haiphong | 2.12M |
| Bien Hoa | 1.1M |
| Hue | 653K |
| Bac Ninh | 520K |
| Hai Duong | 507K |
| Vinh | 490K |
Compare countries by 7 more topics
Population differences between Saint Lucia and Vietnam
|
Saint Lucia
|
Vietnam
|
|
|---|---|---|
| Life expectancy | 73.2 years | 75 years |
| Average age | 36.8 years | 34.9 years |
| Median age | 35.7 years | 34.4 years |
| Male:Female ratio | 49.3:50.7 | 49:51 |
| Fertility rate | 1.39 births per woman | 1.9 births per woman |
| Population density | 766 ppl/mi² | 844 ppl/mi² |
Population map with other countries
Data sources: World Bank | Health (1960–2025, retrieved 2026-07-08); United Nations | World Population Prospects (1960–2026, retrieved 2026-07-08); U.S. Census Bureau (1960–2025, retrieved 2026-07-08); Central Intelligence Agency (CIA) (2000–2019, retrieved 2026-07-08).
GeoRank.org/population/saint-lucia/vietnam | CC BY
Help us show the world through your eyes
Share a photo of your city and help others discover what it looks like to live there. Your contribution makes our data come alive.
Data sources:
- World Bank | Health (1960–2025, retrieved 2026-07-08)
- United Nations | World Population Prospects (1960–2100, retrieved 2026-07-08)
- U.S. Census Bureau (1960–2025, retrieved 2026-07-08)
- Central Intelligence Agency (CIA) (2000–2019, retrieved 2026-07-08)
- Wikidata (2026, retrieved 2026-07-08)
Creative Commons Attribution (CC BY) — you’re free to copy, share, remix, adapt, and use even commercially as long as you give appropriate credit and clearly indicate if you made changes. Other sources may be subject to different license terms.