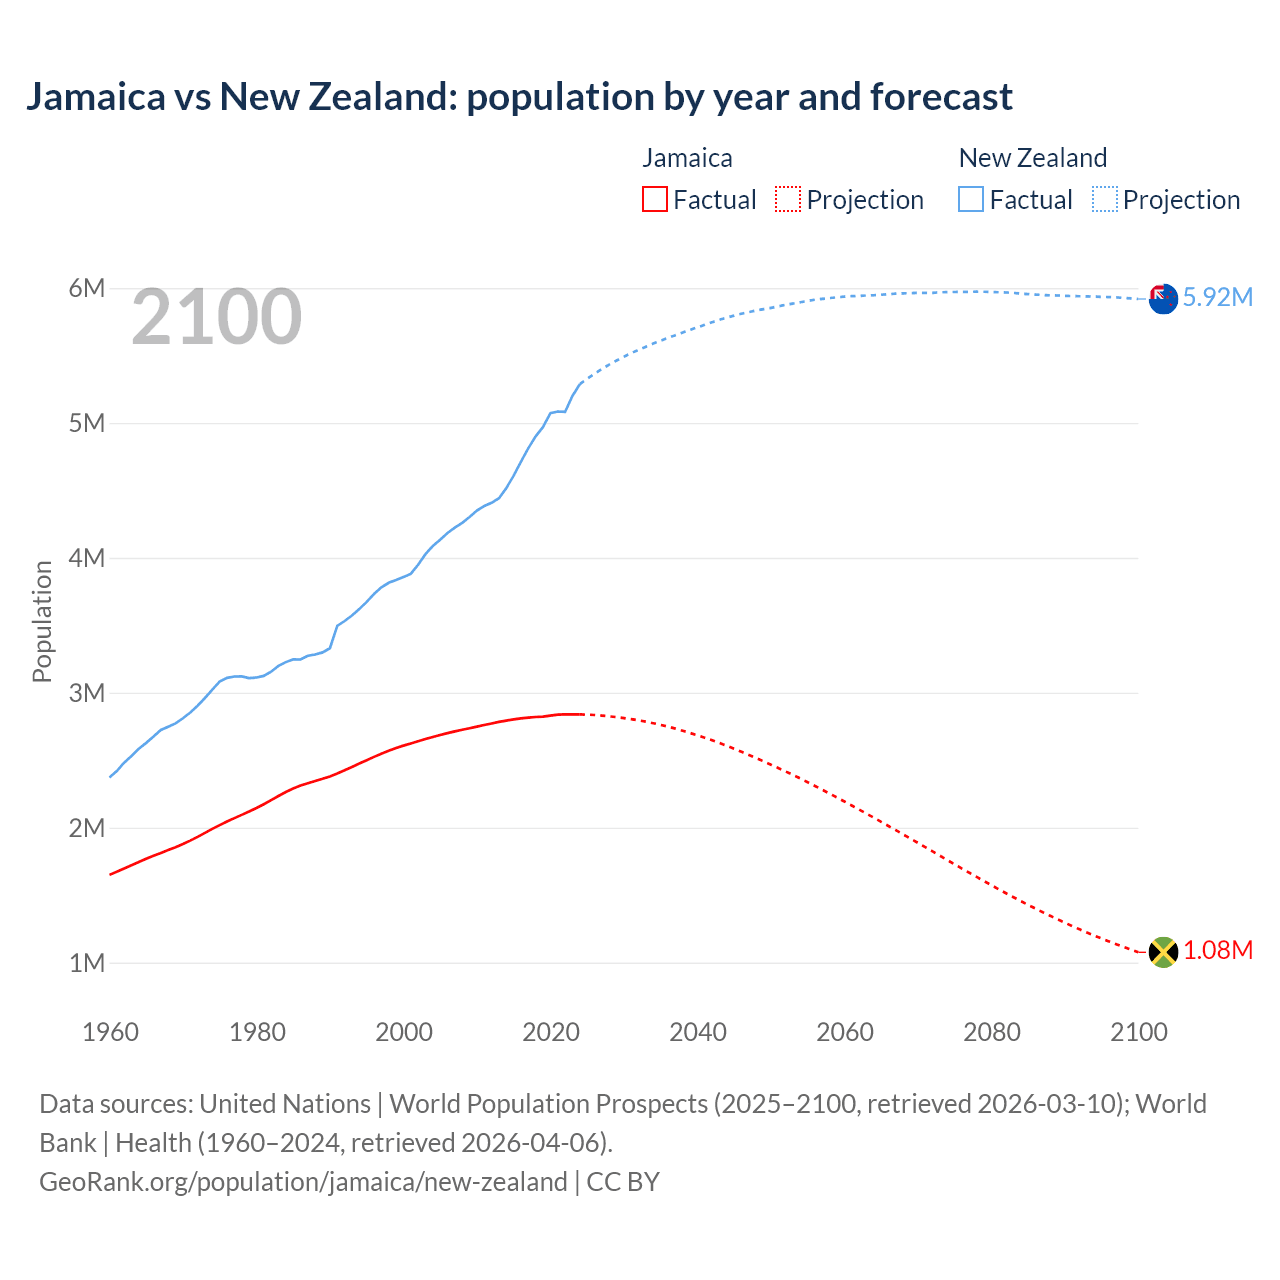
The latest officially reported population of Jamaica was 2,837,077 in 2025 vs 5,324,700 people in New Zealand in 2025. In 2026, based on the adjusted UN estimation, the current Jamaica's population is 2,834,177 people compared to 5,380,024 in New Zealand.
Population statistics:
- New Zealand's population is 1.9 times bigger than Jamaica's.
- Jamaica is ranked the 140th most populous country in the world, while New Zealand is the 124th.
- The countries together account for 0.1% of the world: 0.03% for Jamaica vs 0.06% for New Zealand.
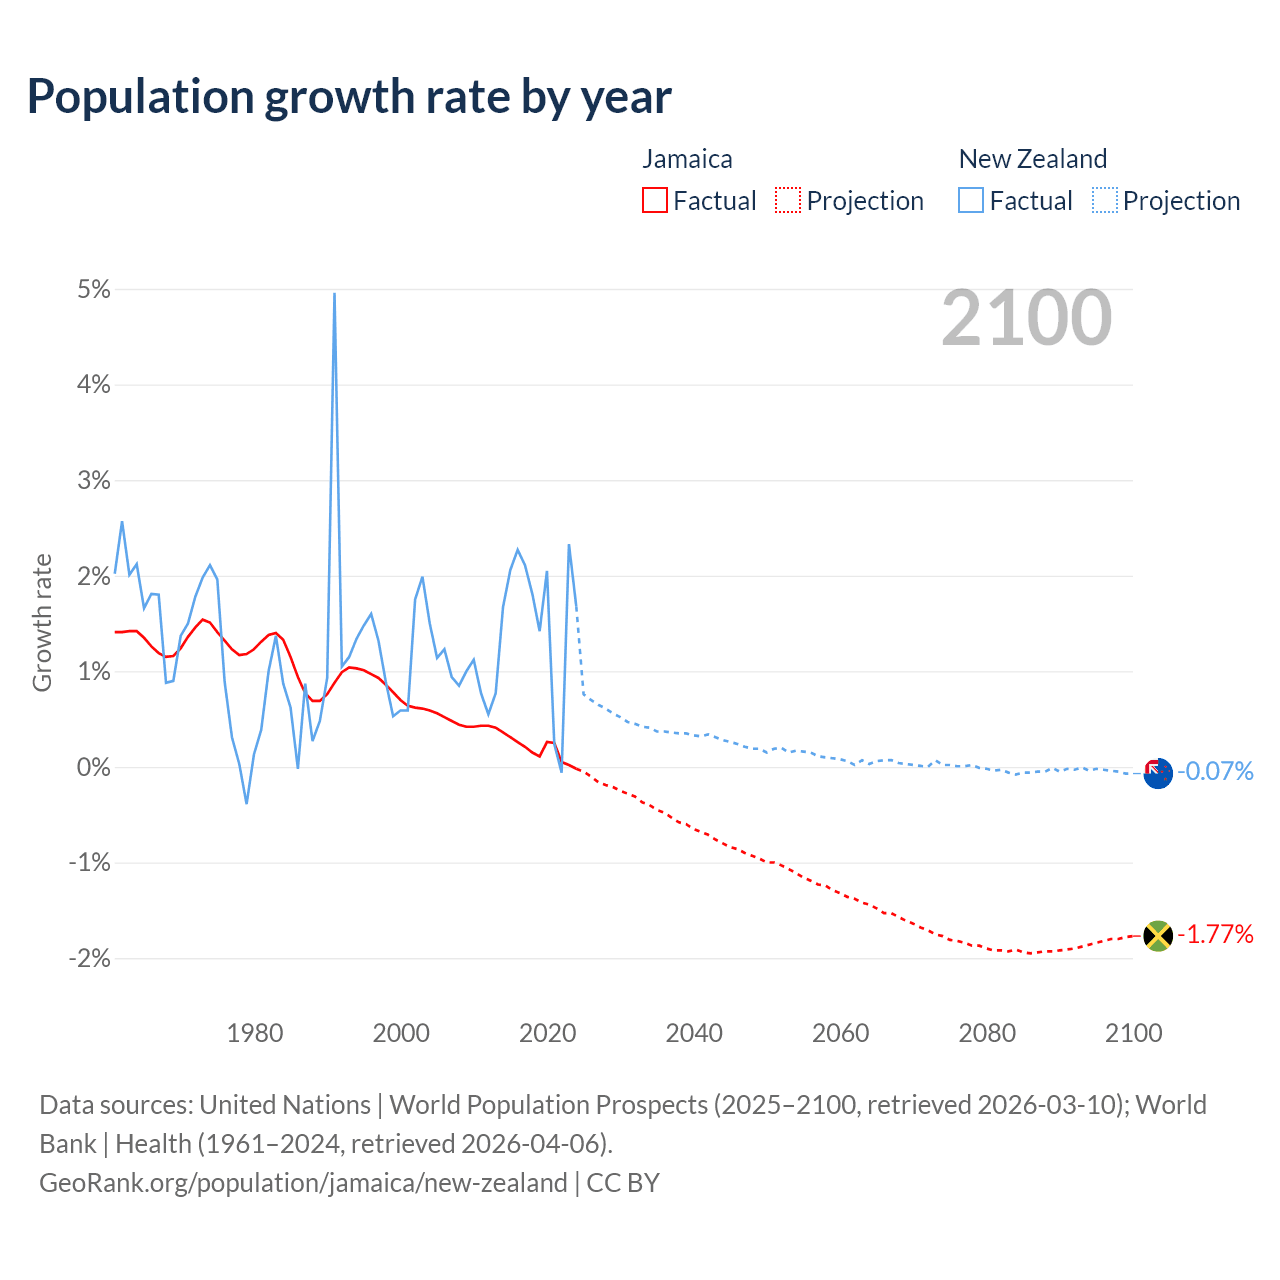
- For the last 10 years, Jamaica has had an average growth rate of +0.14% per year vs +1.51% in New Zealand.
- Since 2006, the population of Jamaica has increased from 2.7M people to 2.83M (4.93% growth), while New Zealand has grown from 4.18M to 5.38M (28.6% growth).
Jamaica vs New Zealand: population by year and forecast
| Year | Population | |
|---|---|---|
 Jamaica
|
 New Zealand
|
|
| 2100 | 1,075,631 | 5,915,768 |
| 2099 | 1,095,039 | 5,920,061 |
| 2098 | 1,114,926 | 5,924,133 |
| 2097 | 1,135,331 | 5,927,189 |
| 2096 | 1,156,197 | 5,929,831 |
| 2095 | 1,177,632 | 5,931,770 |
| 2094 | 1,199,705 | 5,933,105 |
| 2093 | 1,222,447 | 5,935,725 |
| 2092 | 1,245,845 | 5,936,005 |
| 2091 | 1,269,943 | 5,937,584 |
| 2090 | 1,294,621 | 5,938,671 |
| 2089 | 1,319,987 | 5,941,788 |
| 2088 | 1,345,908 | 5,942,552 |
| 2087 | 1,372,420 | 5,945,502 |
| 2086 | 1,399,559 | 5,948,659 |
| 2085 | 1,427,403 | 5,952,187 |
| 2084 | 1,455,598 | 5,956,025 |
| 2083 | 1,483,973 | 5,960,521 |
| 2082 | 1,513,113 | 5,963,849 |
| 2081 | 1,542,698 | 5,965,417 |
| 2080 | 1,572,954 | 5,967,986 |
| 2079 | 1,603,471 | 5,969,234 |
| 2078 | 1,634,036 | 5,969,831 |
| 2077 | 1,665,130 | 5,968,708 |
| 2076 | 1,696,282 | 5,968,290 |
| 2075 | 1,727,653 | 5,967,889 |
| 2074 | 1,759,538 | 5,966,738 |
| 2073 | 1,791,310 | 5,965,412 |
| 2072 | 1,823,277 | 5,961,455 |
| 2071 | 1,855,059 | 5,961,400 |
| 2070 | 1,886,784 | 5,960,718 |
| 2069 | 1,918,215 | 5,959,460 |
| 2068 | 1,949,604 | 5,957,827 |
| 2067 | 1,980,685 | 5,955,348 |
| 2066 | 2,011,465 | 5,951,452 |
| 2065 | 2,042,697 | 5,947,293 |
| 2064 | 2,073,400 | 5,943,767 |
| 2063 | 2,103,669 | 5,941,828 |
| 2062 | 2,133,903 | 5,937,757 |
| 2061 | 2,163,699 | 5,936,521 |
| 2060 | 2,193,436 | 5,933,016 |
| 2059 | 2,222,680 | 5,928,350 |
| 2058 | 2,251,648 | 5,922,743 |
| 2057 | 2,279,932 | 5,916,754 |
| 2056 | 2,308,282 | 5,910,221 |
| 2055 | 2,336,168 | 5,901,290 |
| 2054 | 2,363,575 | 5,891,739 |
| 2053 | 2,390,213 | 5,881,824 |
| 2052 | 2,416,056 | 5,873,115 |
| 2051 | 2,441,297 | 5,861,135 |
| 2050 | 2,466,072 | 5,849,861 |
| 2049 | 2,490,883 | 5,841,135 |
| 2048 | 2,514,954 | 5,830,154 |
| 2047 | 2,538,499 | 5,819,016 |
| 2046 | 2,561,597 | 5,806,848 |
| 2045 | 2,583,931 | 5,792,780 |
| 2044 | 2,605,750 | 5,777,886 |
| 2043 | 2,626,741 | 5,761,590 |
| 2042 | 2,646,740 | 5,743,549 |
| 2041 | 2,665,673 | 5,724,283 |
| 2040 | 2,683,790 | 5,705,914 |
| 2039 | 2,701,261 | 5,687,068 |
| 2038 | 2,717,604 | 5,667,019 |
| 2037 | 2,733,406 | 5,647,323 |
| 2036 | 2,747,946 | 5,627,207 |
| 2035 | 2,761,103 | 5,606,247 |
| 2034 | 2,773,511 | 5,585,417 |
| 2033 | 2,784,591 | 5,562,621 |
| 2032 | 2,794,827 | 5,539,615 |
| 2031 | 2,803,535 | 5,514,530 |
| 2030 | 2,811,500 | 5,488,472 |
| 2029 | 2,818,414 | 5,460,094 |
| 2028 | 2,824,434 | 5,429,936 |
| 2027 | 2,829,732 | 5,397,099 |
| 2026 | 2,834,177 | 5,361,990 |
| 2025 | 2,837,077 | 5,324,700 |
| 2024 | 2,839,175 | 5,290,000 |
| 2023 | 2,839,786 | 5,200,000 |
| 2022 | 2,839,144 | 5,081,700 |
| 2021 | 2,837,682 | 5,084,600 |
| 2020 | 2,830,739 | 5,072,400 |
| 2019 | 2,823,271 | 4,970,300 |
| 2018 | 2,820,097 | 4,900,600 |
| 2017 | 2,815,764 | 4,813,600 |
| 2016 | 2,809,915 | 4,714,100 |
| 2015 | 2,802,534 | 4,609,400 |
| 2014 | 2,793,749 | 4,516,500 |
| 2013 | 2,783,687 | 4,442,100 |
| 2012 | 2,772,430 | 4,408,100 |
| 2011 | 2,760,494 | 4,384,000 |
| 2010 | 2,748,568 | 4,350,700 |
| 2009 | 2,736,995 | 4,302,600 |
| 2008 | 2,725,635 | 4,259,800 |
| 2007 | 2,713,800 | 4,223,800 |
| 2006 | 2,700,968 | 4,184,600 |
| 2005 | 2,687,066 | 4,133,900 |
| 2004 | 2,672,225 | 4,087,500 |
| 2003 | 2,656,623 | 4,027,200 |
| 2002 | 2,640,572 | 3,948,500 |
| 2001 | 2,624,403 | 3,880,500 |
| 2000 | 2,607,826 | 3,857,700 |
| 1999 | 2,589,795 | 3,835,100 |
| 1998 | 2,569,736 | 3,815,000 |
| 1997 | 2,547,848 | 3,781,300 |
| 1996 | 2,524,463 | 3,732,000 |
| 1995 | 2,500,151 | 3,673,400 |
| 1994 | 2,475,220 | 3,620,000 |
| 1993 | 2,449,916 | 3,572,200 |
| 1992 | 2,424,701 | 3,531,700 |
| 1991 | 2,400,869 | 3,495,100 |
| 1990 | 2,379,877 | 3,329,800 |
| 1989 | 2,361,916 | 3,299,200 |
| 1988 | 2,345,777 | 3,283,400 |
| 1987 | 2,329,813 | 3,274,400 |
| 1986 | 2,312,125 | 3,246,300 |
| 1985 | 2,290,656 | 3,247,100 |
| 1984 | 2,264,562 | 3,227,100 |
| 1983 | 2,234,832 | 3,199,300 |
| 1982 | 2,203,889 | 3,156,100 |
| 1981 | 2,173,818 | 3,124,900 |
| 1980 | 2,145,658 | 3,112,900 |
| 1979 | 2,119,486 | 3,109,000 |
| 1978 | 2,094,836 | 3,121,200 |
| 1977 | 2,070,657 | 3,120,200 |
| 1976 | 2,045,578 | 3,110,500 |
| 1975 | 2,018,981 | 3,083,100 |
| 1974 | 1,990,906 | 3,023,700 |
| 1973 | 1,961,219 | 2,961,300 |
| 1972 | 1,931,542 | 2,903,900 |
| 1971 | 1,903,728 | 2,853,000 |
| 1970 | 1,878,196 | 2,810,700 |
| 1969 | 1,855,127 | 2,772,800 |
| 1968 | 1,833,765 | 2,748,100 |
| 1967 | 1,812,865 | 2,724,100 |
| 1966 | 1,791,475 | 2,675,900 |
| 1965 | 1,769,192 | 2,628,400 |
| 1964 | 1,745,568 | 2,585,400 |
| 1963 | 1,721,099 | 2,531,800 |
| 1962 | 1,696,932 | 2,482,000 |
| 1961 | 1,673,261 | 2,419,700 |
| 1960 | 1,650,005 | 2,371,800 |
Data sources: United Nations | World Population Prospects (2026–2100, retrieved 2026-07-08); World Bank | Health (1960–2025, retrieved 2026-07-08).
GeoRank.org/population/jamaica/new-zealand | CC BY 
From 2006 to 2016, the population of Jamaica increased by 108,947 people (a 4.03% growth), while New Zealand gained 529,500 people (a 12.7% growth).
For the next 10 years, from 2016 to 2026, Jamaica gained 24,262 people (a 0.86% growth), while New Zealand's population increased by 665,924 people (a 14.1% growth).
Jamaica was ranked 136th most populous country in 2006 and is 140th in 2026. New Zealand was ranked 122nd in 2006 and ranked 124th now.
The UN's World Population Prospects forecasts that in 24 years (in 2050) Jamaica's population will shrink by 13% to 2,466,072 people with a rank change from 140th to 143rd. The population of New Zealand will increase by 8.73% to 5,849,861 people and rank change from 124th to 122nd.
New Zealand is projected to reach its peak in 2078 at 5.97M people, while Jamaica's population already peaked in 2023 at 2.84M people and is projected to decrease to 1.08M people by 2100.
Population growth rate by year
| Year | Growth rate | |
|---|---|---|
|
Jamaica
|
New Zealand
|
|
| 2100 | -1.77% | -0.07% |
| 2099 | -1.78% | -0.07% |
| 2098 | -1.8% | -0.05% |
| 2097 | -1.8% | -0.04% |
| 2096 | -1.82% | -0.03% |
| 2095 | -1.84% | -0.02% |
| 2094 | -1.86% | -0.04% |
| 2093 | -1.88% | -0.005% |
| 2092 | -1.9% | -0.03% |
| 2091 | -1.91% | -0.02% |
| 2090 | -1.92% | -0.05% |
| 2089 | -1.93% | -0.01% |
| 2088 | -1.93% | -0.05% |
| 2087 | -1.94% | -0.05% |
| 2086 | -1.95% | -0.06% |
| 2085 | -1.94% | -0.06% |
| 2084 | -1.91% | -0.08% |
| 2083 | -1.93% | -0.06% |
| 2082 | -1.92% | -0.03% |
| 2081 | -1.92% | -0.04% |
| 2080 | -1.9% | -0.02% |
| 2079 | -1.87% | -0.01% |
| 2078 | -1.87% | 0.02% |
| 2077 | -1.84% | 0.007% |
| 2076 | -1.82% | 0.007% |
| 2075 | -1.81% | 0.02% |
| 2074 | -1.77% | 0.02% |
| 2073 | -1.75% | 0.07% |
| 2072 | -1.71% | 0.001% |
| 2071 | -1.68% | 0.01% |
| 2070 | -1.64% | 0.02% |
| 2069 | -1.61% | 0.03% |
| 2068 | -1.57% | 0.04% |
| 2067 | -1.53% | 0.07% |
| 2066 | -1.53% | 0.07% |
| 2065 | -1.48% | 0.06% |
| 2064 | -1.44% | 0.03% |
| 2063 | -1.42% | 0.07% |
| 2062 | -1.38% | 0.02% |
| 2061 | -1.36% | 0.06% |
| 2060 | -1.32% | 0.08% |
| 2059 | -1.29% | 0.09% |
| 2058 | -1.24% | 0.1% |
| 2057 | -1.23% | 0.11% |
| 2056 | -1.19% | 0.15% |
| 2055 | -1.16% | 0.16% |
| 2054 | -1.11% | 0.17% |
| 2053 | -1.07% | 0.15% |
| 2052 | -1.03% | 0.2% |
| 2051 | -1% | 0.19% |
| 2050 | -1% | 0.15% |
| 2049 | -0.96% | 0.19% |
| 2048 | -0.93% | 0.19% |
| 2047 | -0.9% | 0.21% |
| 2046 | -0.86% | 0.24% |
| 2045 | -0.84% | 0.26% |
| 2044 | -0.8% | 0.28% |
| 2043 | -0.76% | 0.31% |
| 2042 | -0.71% | 0.34% |
| 2041 | -0.68% | 0.32% |
| 2040 | -0.65% | 0.33% |
| 2039 | -0.6% | 0.35% |
| 2038 | -0.58% | 0.35% |
| 2037 | -0.53% | 0.36% |
| 2036 | -0.48% | 0.37% |
| 2035 | -0.45% | 0.37% |
| 2034 | -0.4% | 0.41% |
| 2033 | -0.37% | 0.42% |
| 2032 | -0.31% | 0.45% |
| 2031 | -0.28% | 0.47% |
| 2030 | -0.25% | 0.52% |
| 2029 | -0.21% | 0.56% |
| 2028 | -0.19% | 0.61% |
| 2027 | -0.16% | 0.65% |
| 2026 | -0.1% | 0.7% |
| 2025 | -0.07% | 0.66% |
| 2024 | -0.02% | 1.73% |
| 2023 | 0.02% | 2.33% |
| 2022 | 0.05% | -0.06% |
| 2021 | 0.25% | 0.24% |
| 2020 | 0.26% | 2.05% |
| 2019 | 0.11% | 1.42% |
| 2018 | 0.15% | 1.81% |
| 2017 | 0.21% | 2.11% |
| 2016 | 0.26% | 2.27% |
| 2015 | 0.31% | 2.06% |
| 2014 | 0.36% | 1.67% |
| 2013 | 0.41% | 0.77% |
| 2012 | 0.43% | 0.55% |
| 2011 | 0.43% | 0.77% |
| 2010 | 0.42% | 1.12% |
| 2009 | 0.42% | 1% |
| 2008 | 0.44% | 0.85% |
| 2007 | 0.48% | 0.94% |
| 2006 | 0.52% | 1.23% |
| 2005 | 0.56% | 1.14% |
| 2004 | 0.59% | 1.5% |
| 2003 | 0.61% | 1.99% |
| 2002 | 0.62% | 1.75% |
| 2001 | 0.64% | 0.59% |
| 2000 | 0.7% | 0.59% |
| 1999 | 0.78% | 0.53% |
| 1998 | 0.86% | 0.89% |
| 1997 | 0.93% | 1.32% |
| 1996 | 0.97% | 1.6% |
| 1995 | 1.01% | 1.48% |
| 1994 | 1.03% | 1.34% |
| 1993 | 1.04% | 1.15% |
| 1992 | 0.99% | 1.05% |
| 1991 | 0.88% | 4.96% |
| 1990 | 0.76% | 0.93% |
| 1989 | 0.69% | 0.48% |
| 1988 | 0.69% | 0.27% |
| 1987 | 0.77% | 0.87% |
| 1986 | 0.94% | -0.02% |
| 1985 | 1.15% | 0.62% |
| 1984 | 1.33% | 0.87% |
| 1983 | 1.4% | 1.37% |
| 1982 | 1.38% | 1% |
| 1981 | 1.31% | 0.39% |
| 1980 | 1.23% | 0.13% |
| 1979 | 1.18% | -0.39% |
| 1978 | 1.17% | 0.03% |
| 1977 | 1.23% | 0.31% |
| 1976 | 1.32% | 0.89% |
| 1975 | 1.41% | 1.96% |
| 1974 | 1.51% | 2.11% |
| 1973 | 1.54% | 1.98% |
| 1972 | 1.46% | 1.78% |
| 1971 | 1.36% | 1.5% |
| 1970 | 1.24% | 1.37% |
| 1969 | 1.16% | 0.9% |
| 1968 | 1.15% | 0.88% |
| 1967 | 1.19% | 1.8% |
| 1966 | 1.26% | 1.81% |
| 1965 | 1.35% | 1.66% |
| 1964 | 1.42% | 2.12% |
| 1963 | 1.42% | 2.01% |
| 1962 | 1.41% | 2.57% |
| 1961 | 1.41% | 2.02% |
Data sources: United Nations | World Population Prospects (2026–2100, retrieved 2026-07-08); World Bank | Health (1961–2025, retrieved 2026-07-08).
GeoRank.org/population/jamaica/new-zealand | CC BY
In 2025, the population of Jamaica declined by 0.07%, while New Zealand's population grew by 0.66%.
Live population counters
|
Jamaica
|
New Zealand
|
|
|---|---|---|
| Current population |
2834177
|
5380024
|
| Population rank | 140/197 | 124/197 |
| Percent of world population | 0.03% | 0.06% |
| One net population change |
4.19 hours
|
15.2 minutes
|
| One birth every |
16.2 minutes
|
9.01 minutes
|
| One death every |
22.6 minutes
|
13.9 minutes
|
| Daily growth/decline | -6 | +95 |
| Annual growth/decline | -2,098 | +34,700 |
| Annual growth/decline rate | -0.07% | +0.66% |
| Population growth rate rank | 165/197 | 118/197 |
| One migration net change every |
47.7 minutes
|
30.3 minutes
|
| Annual migration change | -11,053 | +17,403 |
| Net migration rank | 135/196 | 35/196 |
| Foreign-born residents | 24,007 | 1,467,989 |
| Foreign-born residents rank | 168/195 | 45/195 |
| Foreign-born share of population | 0.8% | 28.2% |
| Foreign-born share rank | 161/195 | 20/195 |
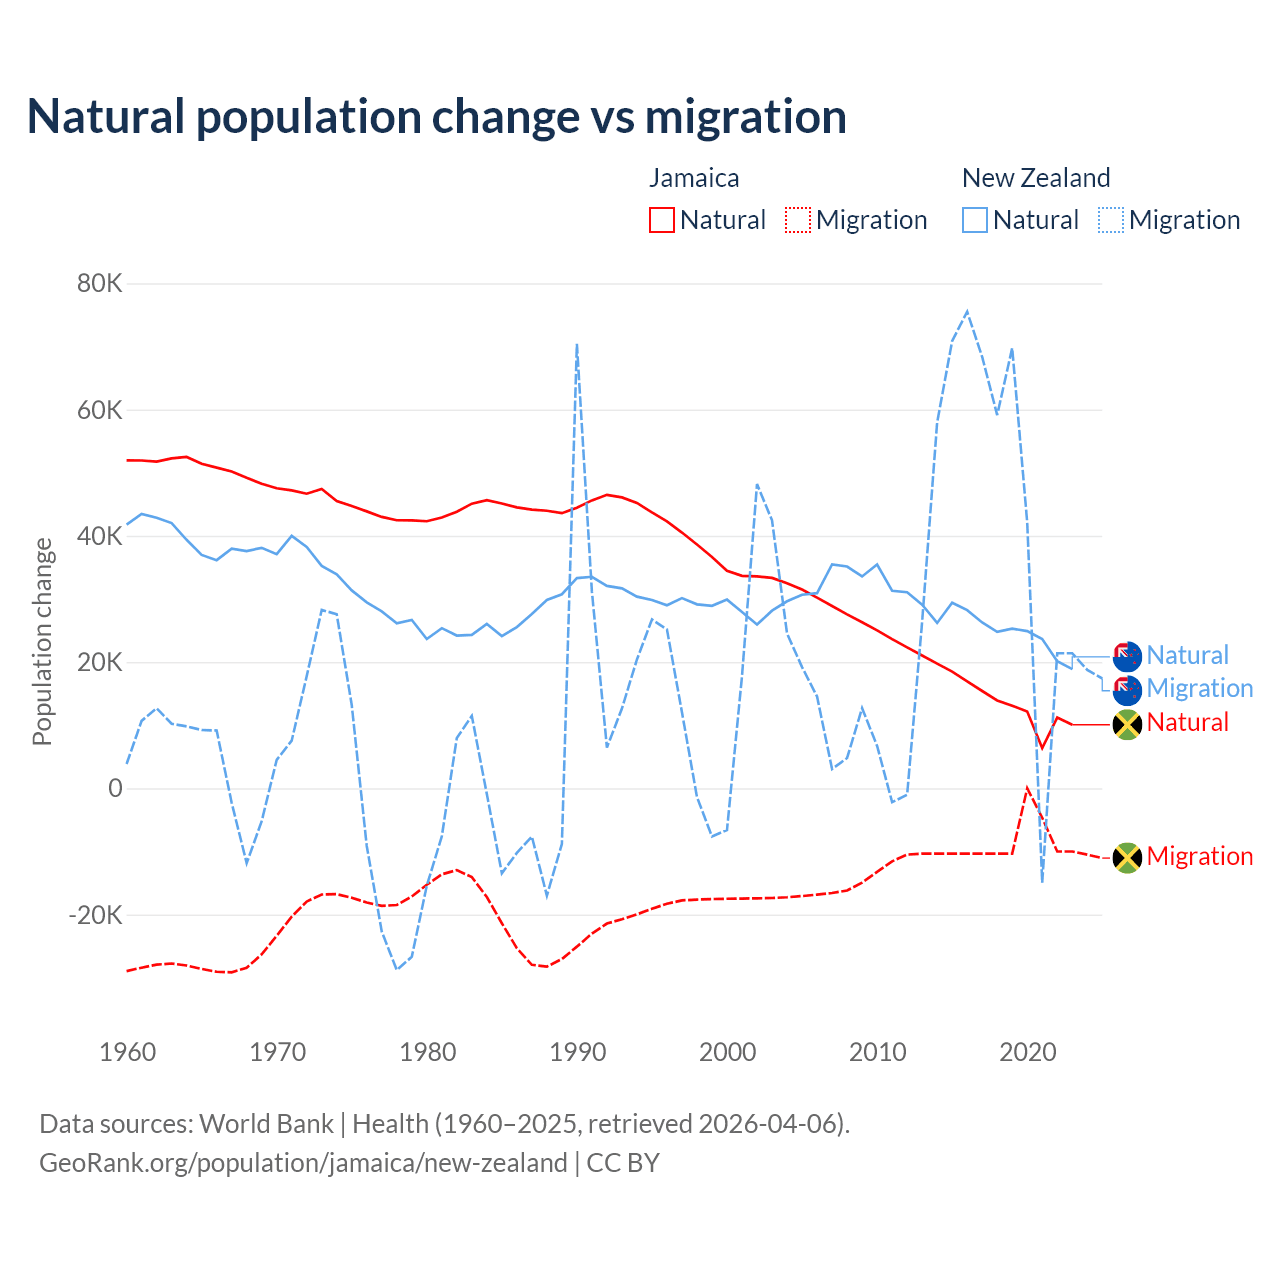
Natural population change vs migration
| Year | Population change | |||
|---|---|---|---|---|
|
Jamaica
|
New Zealand
|
|||
| Natural | Migration | Natural | Migration | |
| 2025 | - | -11,053 | - | 17,403 |
| 2024 | 9,210 | -10,506 | 20,631 | 18,766 |
| 2023 | 10,072 | -10,003 | 19,031 | 21,404 |
| 2022 | 11,215 | -10,003 | 20,276 | 21,404 |
| 2021 | 6,382 | -4,665 | 23,745 | -14,944 |
| 2020 | 12,170 | 0 | 25,007 | 42,124 |
| 2019 | 13,094 | -10,335 | 25,349 | 69,770 |
| 2018 | 13,929 | -10,335 | 24,797 | 59,139 |
| 2017 | 15,419 | -10,335 | 26,282 | 68,349 |
| 2016 | 16,944 | -10,335 | 28,237 | 75,512 |
| 2015 | 18,489 | -10,335 | 29,408 | 70,870 |
| 2014 | 19,751 | -10,335 | 26,196 | 57,974 |
| 2013 | 21,037 | -10,335 | 29,096 | 26,385 |
| 2012 | 22,320 | -10,498 | 31,077 | -1,015 |
| 2011 | 23,627 | -11,577 | 31,302 | -2,196 |
| 2010 | 25,031 | -13,248 | 35,458 | 6,722 |
| 2009 | 26,311 | -14,941 | 33,560 | 12,700 |
| 2008 | 27,553 | -16,191 | 35,143 | 4,804 |
| 2007 | 28,886 | -16,588 | 35,480 | 3,053 |
| 2006 | 30,213 | -16,840 | 30,924 | 14,542 |
| 2005 | 31,506 | -17,071 | 30,674 | 19,212 |
| 2004 | 32,500 | -17,256 | 29,634 | 24,521 |
| 2003 | 33,340 | -17,380 | 28,150 | 42,456 |
| 2002 | 33,572 | -17,428 | 25,941 | 48,195 |
| 2001 | 33,666 | -17,466 | 27,939 | 17,793 |
| 2000 | 34,452 | -17,498 | 29,897 | -6,604 |
| 1999 | 36,649 | -17,542 | 28,916 | -7,634 |
| 1998 | 38,628 | -17,623 | 29,146 | -1,387 |
| 1997 | 40,521 | -17,756 | 30,137 | 12,040 |
| 1996 | 42,297 | -18,285 | 28,997 | 25,169 |
| 1995 | 43,705 | -19,092 | 29,828 | 26,743 |
| 1994 | 45,210 | -19,960 | 30,372 | 20,420 |
| 1993 | 46,090 | -20,731 | 31,685 | 12,638 |
| 1992 | 46,494 | -21,426 | 32,067 | 6,460 |
| 1991 | 45,617 | -23,014 | 33,518 | 31,156 |
| 1990 | 44,465 | -25,085 | 33,298 | 70,432 |
| 1989 | 43,591 | -27,049 | 30,749 | -8,818 |
| 1988 | 43,978 | -28,247 | 29,846 | -17,005 |
| 1987 | 44,155 | -27,958 | 27,603 | -7,631 |
| 1986 | 44,520 | -25,339 | 25,549 | -10,234 |
| 1985 | 45,122 | -21,371 | 24,126 | -13,462 |
| 1984 | 45,644 | -17,211 | 26,043 | -901 |
| 1983 | 45,095 | -14,065 | 24,315 | 11,464 |
| 1982 | 43,816 | -12,952 | 24,207 | 7,982 |
| 1981 | 42,898 | -13,619 | 25,374 | -7,606 |
| 1980 | 42,316 | -15,277 | 23,658 | -15,423 |
| 1979 | 42,449 | -17,143 | 26,675 | -26,694 |
| 1978 | 42,475 | -18,483 | 26,156 | -28,783 |
| 1977 | 42,999 | -18,630 | 28,020 | -22,697 |
| 1976 | 43,878 | -18,084 | 29,456 | -9,138 |
| 1975 | 44,736 | -17,340 | 31,355 | 13,196 |
| 1974 | 45,526 | -16,769 | 33,896 | 27,580 |
| 1973 | 47,438 | -16,822 | 35,239 | 28,261 |
| 1972 | 46,676 | -17,934 | 38,244 | 17,779 |
| 1971 | 47,206 | -20,322 | 40,000 | 7,547 |
| 1970 | 47,547 | -23,371 | 37,101 | 4,511 |
| 1969 | 48,258 | -26,304 | 38,098 | -5,212 |
| 1968 | 49,189 | -28,424 | 37,594 | -11,853 |
| 1967 | 50,187 | -29,147 | 37,974 | -2,289 |
| 1966 | 50,808 | -29,065 | 36,151 | 9,161 |
| 1965 | 51,423 | -28,611 | 36,982 | 9,245 |
| 1964 | 52,501 | -28,066 | 39,375 | 9,806 |
| 1963 | 52,277 | -27,757 | 42,027 | 10,226 |
| 1962 | 51,758 | -27,936 | 42,865 | 12,697 |
| 1961 | 51,931 | -28,416 | 43,482 | 10,689 |
| 1960 | 51,944 | -28,952 | 41,791 | 3,846 |
Data sources: World Bank | Health (1960–2025, retrieved 2026-07-08).
GeoRank.org/population/jamaica/new-zealand | CC BY
Over the last 10 years, 59.4% of the population change in Jamaica is from natural causes (a gain of 126,924 people) and 40.6% is from migration (a loss of 86,852 people). In New Zealand 36% is from natural causes (a gain of 242,763 people) and 64% is from migration (a gain of 432,394 people).
As of 2024, 24,007 residents or 0.8% of the population were not native-born in Jamaica, compared to 1,467,989 people or 28.2% in New Zealand.
Biggest cities by population
|
Jamaica
|
|
|---|---|
| City | Population |
| Kingston | 938K |
| Spanish Town | 131K |
| Montego Bay | 124K |
| May Pen | 61.5K |
| Mandeville | 48.3K |
| Old Harbour | 28.7K |
| Linstead | 22.8K |
| Savanna-la-Mar | 22.6K |
| Port Antonio | 14.8K |
|
New Zealand
|
|
|---|---|
| City | Population |
| Auckland | 1.47M |
| Christchurch | 383K |
| Wellington | 216K |
| Hamilton | 176K |
| Tauranga | 151K |
| Dunedin | 106K |
| Lower Hutt | 103K |
| Palmerston North | 81.5K |
| Napier | 66.3K |
| Hibiscus Coast | 59.8K |
Compare countries by 7 more topics
Population differences between Jamaica and New Zealand
|
Jamaica
|
New Zealand
|
|
|---|---|---|
| Life expectancy | 71.9 years | 82.5 years |
| Average age | 35.2 years | 40 years |
| Median age | 33.8 years | 38.8 years |
| Male:Female ratio | 49.4:50.6 | 49.7:50.3 |
| Fertility rate | 1.35 births per woman | 1.57 births per woman |
| Population density | 678 ppl/mi² | 52.7 ppl/mi² |
Population map with other countries
Data sources: World Bank | Health (1960–2025, retrieved 2026-07-08); United Nations | World Population Prospects (1960–2026, retrieved 2026-07-08); U.S. Census Bureau (1960–2025, retrieved 2026-07-08); Central Intelligence Agency (CIA) (2000–2019, retrieved 2026-07-08).
GeoRank.org/population/jamaica/new-zealand | CC BY
Help us show the world through your eyes
Share a photo of your city and help others discover what it looks like to live there. Your contribution makes our data come alive.
Data sources:
- World Bank | Health (1960–2025, retrieved 2026-07-08)
- United Nations | World Population Prospects (1960–2100, retrieved 2026-07-08)
- U.S. Census Bureau (1960–2025, retrieved 2026-07-08)
- Central Intelligence Agency (CIA) (2000–2019, retrieved 2026-07-08)
- Wikidata (2026, retrieved 2026-07-08)
Creative Commons Attribution (CC BY) — you’re free to copy, share, remix, adapt, and use even commercially as long as you give appropriate credit and clearly indicate if you made changes. Other sources may be subject to different license terms.