The latest officially reported population of Equatorial Guinea was 1,938,431 in 2025 vs 7,013,078 people in Paraguay in 2025. In 2026, based on the adjusted UN estimation, the current Equatorial Guinea's population is 2,008,950 people compared to 7,138,671 in Paraguay.
Population statistics:
- Paraguay's population is 3.55 times bigger than Equatorial Guinea's.
- Equatorial Guinea is ranked the 148th most populous country in the world, while Paraguay is the 108th.
- The countries together account for 0.11% of the world: 0.02% for Equatorial Guinea vs 0.09% for Paraguay.
- For the last 10 years, Equatorial Guinea has had an average growth rate of +3.01% per year vs +1.32% in Paraguay.
- Since 2006, the population of Equatorial Guinea has increased from 990K people to 2.01M (102.9% growth), while Paraguay has grown from 5.51M to 7.14M (29.7% growth).
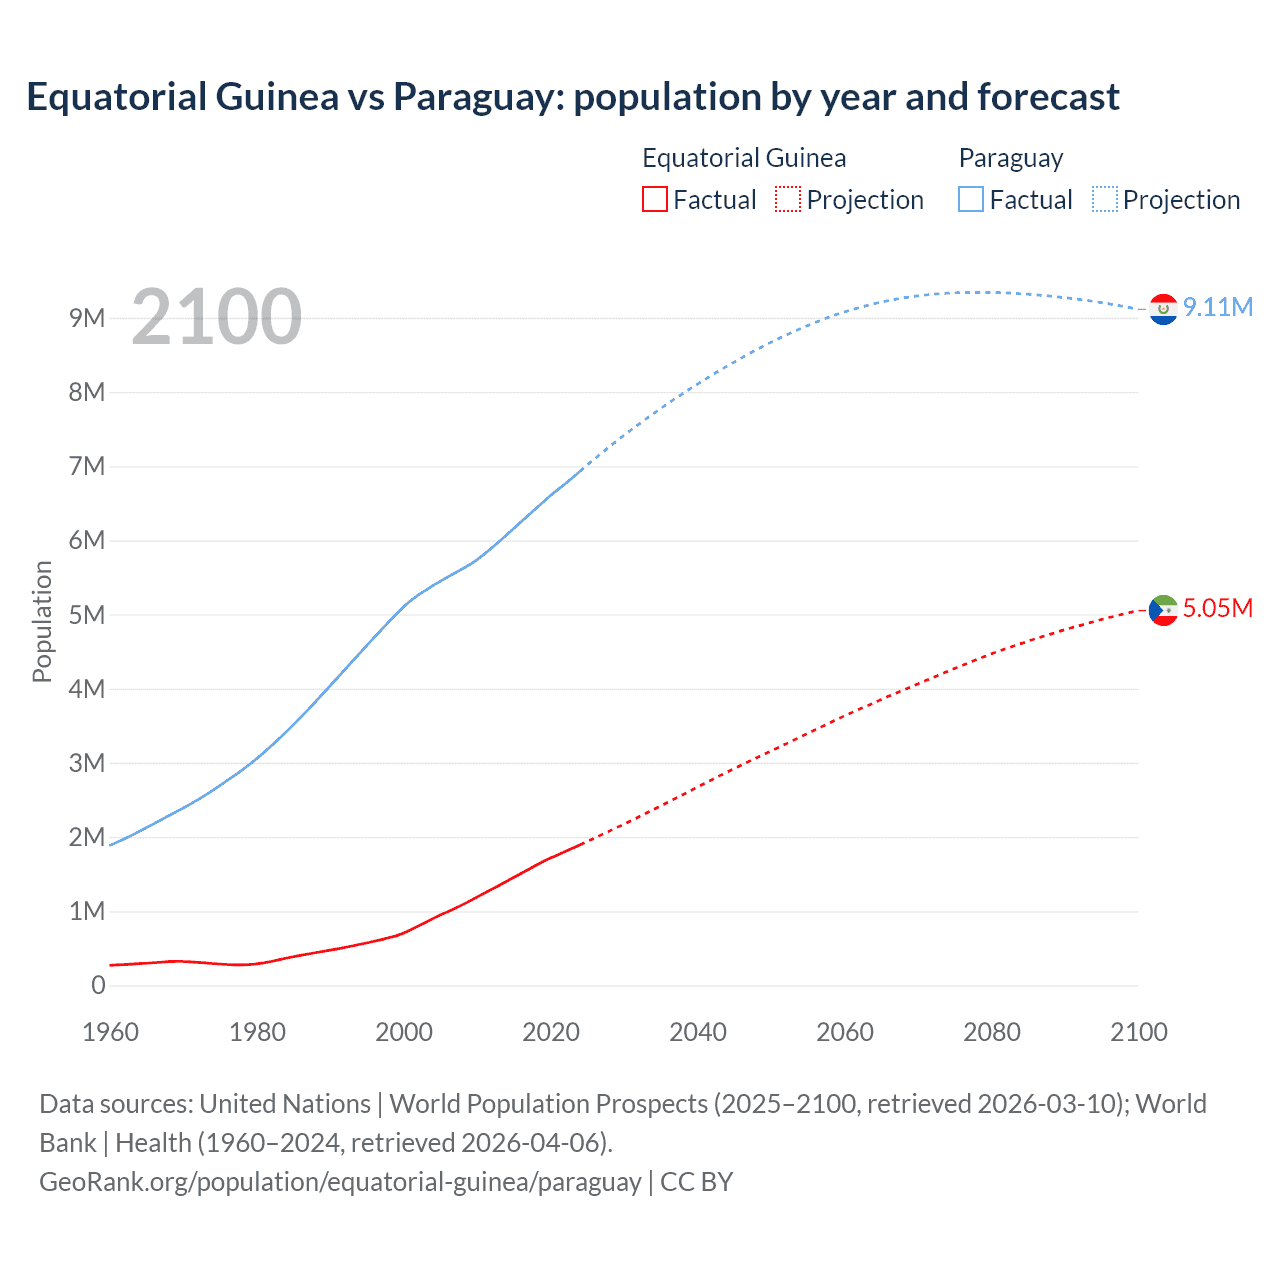
Equatorial Guinea vs Paraguay: population by year and forecast
| Year | Population | |
|---|---|---|
 Equatorial Guinea
|
 Paraguay
|
|
| 2100 | 5,052,131 | 9,112,687 |
| 2099 | 5,029,652 | 9,133,083 |
| 2098 | 5,006,084 | 9,151,984 |
| 2097 | 4,982,012 | 9,170,087 |
| 2096 | 4,957,949 | 9,187,135 |
| 2095 | 4,932,205 | 9,203,013 |
| 2094 | 4,904,343 | 9,218,194 |
| 2093 | 4,876,701 | 9,232,470 |
| 2092 | 4,848,908 | 9,245,852 |
| 2091 | 4,822,809 | 9,258,741 |
| 2090 | 4,795,108 | 9,270,641 |
| 2089 | 4,764,284 | 9,282,170 |
| 2088 | 4,733,165 | 9,291,959 |
| 2087 | 4,702,620 | 9,300,904 |
| 2086 | 4,672,149 | 9,309,688 |
| 2085 | 4,641,070 | 9,317,464 |
| 2084 | 4,606,158 | 9,323,625 |
| 2083 | 4,573,271 | 9,329,231 |
| 2082 | 4,539,781 | 9,334,021 |
| 2081 | 4,504,490 | 9,338,192 |
| 2080 | 4,468,448 | 9,340,792 |
| 2079 | 4,429,954 | 9,342,369 |
| 2078 | 4,392,051 | 9,342,577 |
| 2077 | 4,353,283 | 9,341,699 |
| 2076 | 4,311,896 | 9,339,777 |
| 2075 | 4,270,301 | 9,336,119 |
| 2074 | 4,229,407 | 9,331,059 |
| 2073 | 4,188,677 | 9,324,304 |
| 2072 | 4,147,163 | 9,315,864 |
| 2071 | 4,106,058 | 9,306,098 |
| 2070 | 4,063,448 | 9,294,400 |
| 2069 | 4,020,982 | 9,281,039 |
| 2068 | 3,980,402 | 9,266,275 |
| 2067 | 3,938,530 | 9,250,050 |
| 2066 | 3,895,974 | 9,231,342 |
| 2065 | 3,851,911 | 9,211,132 |
| 2064 | 3,807,263 | 9,188,572 |
| 2063 | 3,763,880 | 9,163,581 |
| 2062 | 3,720,515 | 9,136,419 |
| 2061 | 3,676,341 | 9,107,921 |
| 2060 | 3,631,498 | 9,077,798 |
| 2059 | 3,585,230 | 9,045,532 |
| 2058 | 3,537,155 | 9,010,196 |
| 2057 | 3,490,505 | 8,973,356 |
| 2056 | 3,443,649 | 8,934,666 |
| 2055 | 3,395,823 | 8,894,376 |
| 2054 | 3,347,521 | 8,852,244 |
| 2053 | 3,299,880 | 8,808,628 |
| 2052 | 3,252,101 | 8,763,131 |
| 2051 | 3,204,837 | 8,716,069 |
| 2050 | 3,158,169 | 8,667,821 |
| 2049 | 3,111,550 | 8,617,987 |
| 2048 | 3,064,766 | 8,566,482 |
| 2047 | 3,018,583 | 8,513,601 |
| 2046 | 2,970,723 | 8,458,430 |
| 2045 | 2,921,709 | 8,402,494 |
| 2044 | 2,872,120 | 8,345,365 |
| 2043 | 2,823,047 | 8,287,161 |
| 2042 | 2,772,948 | 8,227,296 |
| 2041 | 2,723,274 | 8,166,606 |
| 2040 | 2,671,956 | 8,104,911 |
| 2039 | 2,621,748 | 8,041,701 |
| 2038 | 2,569,597 | 7,976,905 |
| 2037 | 2,518,735 | 7,911,144 |
| 2036 | 2,468,255 | 7,843,935 |
| 2035 | 2,418,303 | 7,775,617 |
| 2034 | 2,368,234 | 7,706,326 |
| 2033 | 2,319,422 | 7,635,458 |
| 2032 | 2,269,119 | 7,563,007 |
| 2031 | 2,220,354 | 7,489,427 |
| 2030 | 2,172,696 | 7,414,080 |
| 2029 | 2,125,745 | 7,337,101 |
| 2028 | 2,078,701 | 7,258,394 |
| 2027 | 2,031,611 | 7,178,461 |
| 2026 | 1,985,016 | 7,096,647 |
| 2025 | 1,938,431 | 7,013,078 |
| 2024 | 1,892,516 | 6,929,153 |
| 2023 | 1,847,549 | 6,844,146 |
| 2022 | 1,803,545 | 6,760,464 |
| 2021 | 1,758,786 | 6,684,182 |
| 2020 | 1,716,468 | 6,603,739 |
| 2019 | 1,670,177 | 6,515,058 |
| 2018 | 1,616,422 | 6,427,382 |
| 2017 | 1,562,396 | 6,338,660 |
| 2016 | 1,508,186 | 6,249,126 |
| 2015 | 1,453,923 | 6,159,103 |
| 2014 | 1,399,828 | 6,069,811 |
| 2013 | 1,346,218 | 5,982,445 |
| 2012 | 1,293,483 | 5,897,008 |
| 2011 | 1,241,835 | 5,814,626 |
| 2010 | 1,189,085 | 5,737,971 |
| 2009 | 1,135,673 | 5,671,236 |
| 2008 | 1,084,530 | 5,613,574 |
| 2007 | 1,036,044 | 5,559,386 |
| 2006 | 990,343 | 5,505,148 |
| 2005 | 947,367 | 5,448,097 |
| 2004 | 899,917 | 5,388,175 |
| 2003 | 847,862 | 5,326,436 |
| 2002 | 797,957 | 5,261,328 |
| 2001 | 749,836 | 5,187,689 |
| 2000 | 703,279 | 5,100,868 |
| 1999 | 667,214 | 5,003,135 |
| 1998 | 641,474 | 4,900,025 |
| 1997 | 616,893 | 4,794,412 |
| 1996 | 593,492 | 4,687,543 |
| 1995 | 571,264 | 4,579,806 |
| 1994 | 550,138 | 4,471,417 |
| 1993 | 530,023 | 4,362,696 |
| 1992 | 510,770 | 4,253,600 |
| 1991 | 492,217 | 4,144,364 |
| 1990 | 474,274 | 4,035,747 |
| 1989 | 456,808 | 3,927,802 |
| 1988 | 439,651 | 3,820,546 |
| 1987 | 422,522 | 3,714,889 |
| 1986 | 404,728 | 3,611,474 |
| 1985 | 385,547 | 3,510,671 |
| 1984 | 364,899 | 3,412,936 |
| 1983 | 343,421 | 3,318,068 |
| 1982 | 322,216 | 3,226,189 |
| 1981 | 303,252 | 3,137,604 |
| 1980 | 288,644 | 3,053,235 |
| 1979 | 279,846 | 2,973,968 |
| 1978 | 276,531 | 2,899,269 |
| 1977 | 276,779 | 2,827,874 |
| 1976 | 281,031 | 2,758,836 |
| 1975 | 287,901 | 2,691,648 |
| 1974 | 294,953 | 2,625,621 |
| 1973 | 302,281 | 2,561,102 |
| 1972 | 309,468 | 2,499,881 |
| 1971 | 315,940 | 2,442,537 |
| 1970 | 320,803 | 2,388,028 |
| 1969 | 322,517 | 2,334,992 |
| 1968 | 318,849 | 2,282,391 |
| 1967 | 311,805 | 2,229,994 |
| 1966 | 304,859 | 2,177,584 |
| 1965 | 298,238 | 2,125,177 |
| 1964 | 291,942 | 2,073,119 |
| 1963 | 285,965 | 2,021,909 |
| 1962 | 280,286 | 1,973,130 |
| 1961 | 274,896 | 1,927,394 |
| 1960 | 269,807 | 1,883,514 |
Data sources: United Nations | World Population Prospects (2026–2100, retrieved 2026-07-08); World Bank | Health (1960–2025, retrieved 2026-07-08).
GeoRank.org/population/equatorial-guinea/paraguay | CC BY 
From 2006 to 2016, the population of Equatorial Guinea increased by 517,843 people (a 52.3% growth), while Paraguay gained 743,978 people (a 13.5% growth).
For the next 10 years, from 2016 to 2026, Equatorial Guinea gained 500,764 people (a 33.2% growth), while Paraguay's population increased by 889,545 people (a 14.2% growth).
Equatorial Guinea was ranked 154th most populous country in 2006 and is 148th in 2026. Paraguay was ranked 107th in 2006 and ranked 108th now.
The UN's World Population Prospects forecasts that in 24 years (in 2050) Equatorial Guinea's population will grow by 57.2% to 3,158,169 people with a rank change from 148th to 140th. The population of Paraguay will increase by 21.4% to 8,667,821 people and rank change from 108th to 110th.
Equatorial Guinea is projected to reach its peak in 2100 at 5.05M people compared to the peak of 9.34M people in 2078 for Paraguay.
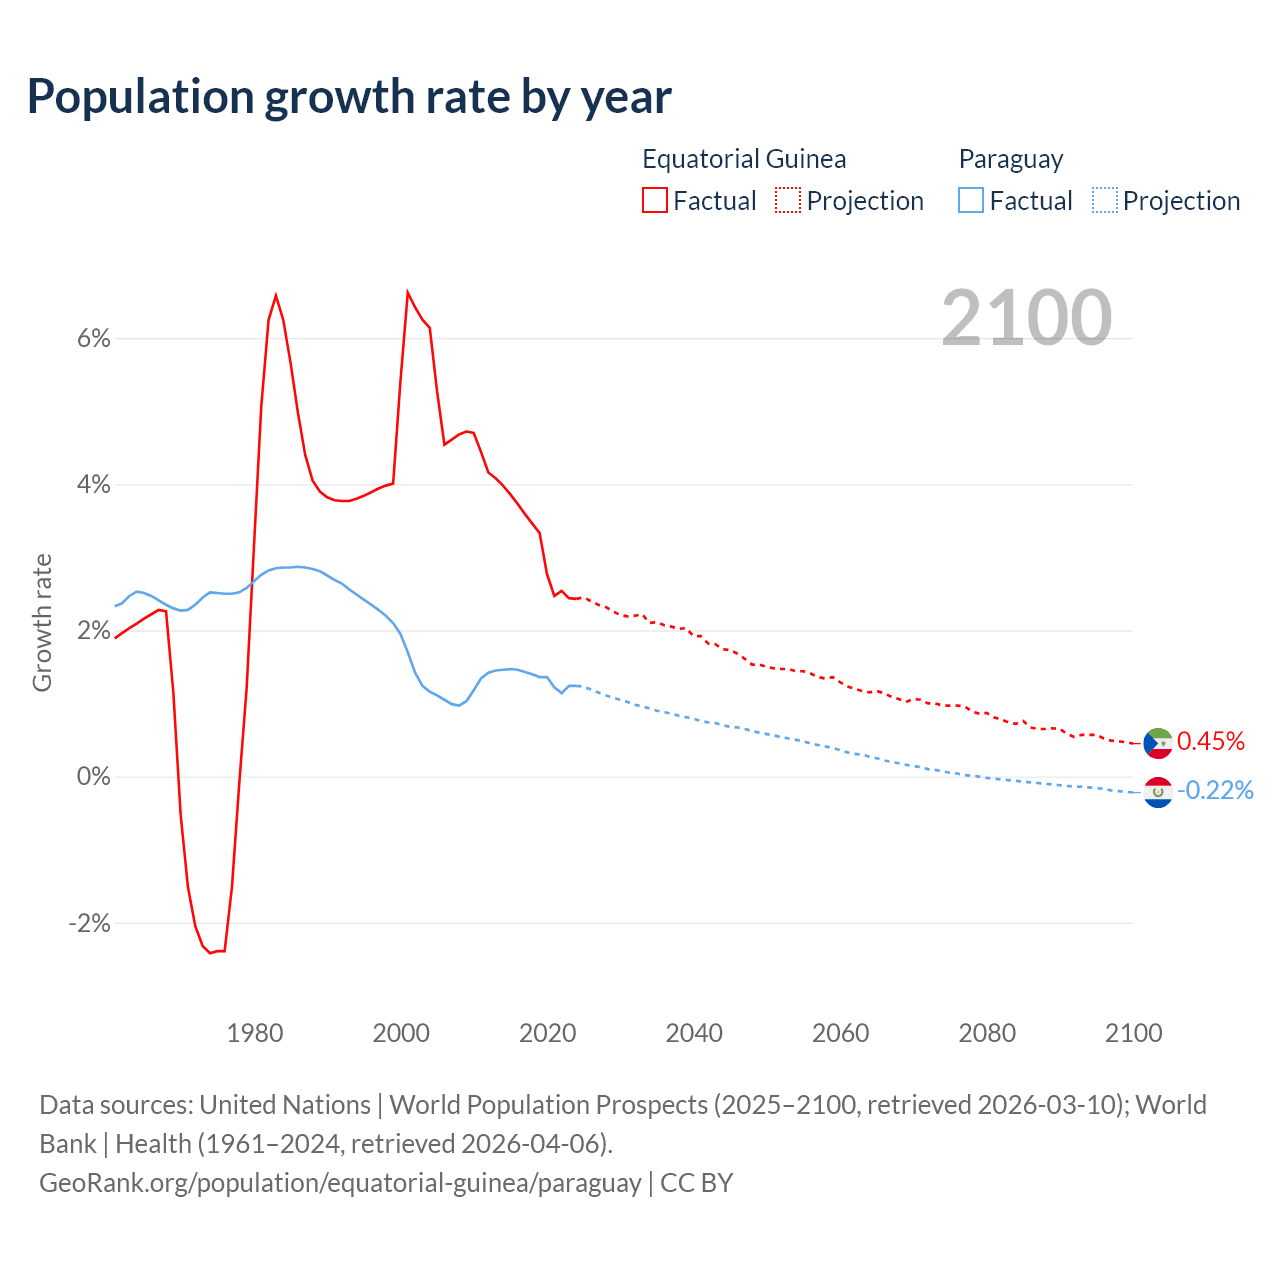
Population growth rate by year
| Year | Growth rate | |
|---|---|---|
|
Equatorial Guinea
|
Paraguay
|
|
| 2100 | 0.45% | -0.22% |
| 2099 | 0.47% | -0.21% |
| 2098 | 0.48% | -0.2% |
| 2097 | 0.49% | -0.19% |
| 2096 | 0.52% | -0.17% |
| 2095 | 0.57% | -0.16% |
| 2094 | 0.57% | -0.15% |
| 2093 | 0.57% | -0.14% |
| 2092 | 0.54% | -0.14% |
| 2091 | 0.58% | -0.13% |
| 2090 | 0.65% | -0.12% |
| 2089 | 0.66% | -0.11% |
| 2088 | 0.65% | -0.1% |
| 2087 | 0.65% | -0.09% |
| 2086 | 0.67% | -0.08% |
| 2085 | 0.76% | -0.07% |
| 2084 | 0.72% | -0.06% |
| 2083 | 0.74% | -0.05% |
| 2082 | 0.78% | -0.04% |
| 2081 | 0.81% | -0.03% |
| 2080 | 0.87% | -0.02% |
| 2079 | 0.86% | -0.002% |
| 2078 | 0.89% | 0.009% |
| 2077 | 0.96% | 0.02% |
| 2076 | 0.97% | 0.04% |
| 2075 | 0.97% | 0.05% |
| 2074 | 0.97% | 0.07% |
| 2073 | 1% | 0.09% |
| 2072 | 1% | 0.1% |
| 2071 | 1.05% | 0.13% |
| 2070 | 1.06% | 0.14% |
| 2069 | 1.02% | 0.16% |
| 2068 | 1.06% | 0.18% |
| 2067 | 1.09% | 0.2% |
| 2066 | 1.14% | 0.22% |
| 2065 | 1.17% | 0.25% |
| 2064 | 1.15% | 0.27% |
| 2063 | 1.17% | 0.3% |
| 2062 | 1.2% | 0.31% |
| 2061 | 1.23% | 0.33% |
| 2060 | 1.29% | 0.36% |
| 2059 | 1.36% | 0.39% |
| 2058 | 1.34% | 0.41% |
| 2057 | 1.36% | 0.43% |
| 2056 | 1.41% | 0.45% |
| 2055 | 1.44% | 0.48% |
| 2054 | 1.44% | 0.5% |
| 2053 | 1.47% | 0.52% |
| 2052 | 1.47% | 0.54% |
| 2051 | 1.48% | 0.56% |
| 2050 | 1.5% | 0.58% |
| 2049 | 1.53% | 0.6% |
| 2048 | 1.53% | 0.62% |
| 2047 | 1.61% | 0.65% |
| 2046 | 1.68% | 0.67% |
| 2045 | 1.73% | 0.68% |
| 2044 | 1.74% | 0.7% |
| 2043 | 1.81% | 0.73% |
| 2042 | 1.82% | 0.74% |
| 2041 | 1.92% | 0.76% |
| 2040 | 1.92% | 0.79% |
| 2039 | 2.03% | 0.81% |
| 2038 | 2.02% | 0.83% |
| 2037 | 2.05% | 0.86% |
| 2036 | 2.07% | 0.88% |
| 2035 | 2.11% | 0.9% |
| 2034 | 2.1% | 0.93% |
| 2033 | 2.22% | 0.96% |
| 2032 | 2.2% | 0.98% |
| 2031 | 2.19% | 1.02% |
| 2030 | 2.21% | 1.05% |
| 2029 | 2.26% | 1.08% |
| 2028 | 2.32% | 1.11% |
| 2027 | 2.35% | 1.15% |
| 2026 | 2.4% | 1.19% |
| 2025 | 2.43% | 1.21% |
| 2024 | 2.43% | 1.24% |
| 2023 | 2.44% | 1.24% |
| 2022 | 2.54% | 1.14% |
| 2021 | 2.47% | 1.22% |
| 2020 | 2.77% | 1.36% |
| 2019 | 3.33% | 1.36% |
| 2018 | 3.46% | 1.4% |
| 2017 | 3.59% | 1.43% |
| 2016 | 3.73% | 1.46% |
| 2015 | 3.86% | 1.47% |
| 2014 | 3.98% | 1.46% |
| 2013 | 4.08% | 1.45% |
| 2012 | 4.16% | 1.42% |
| 2011 | 4.44% | 1.34% |
| 2010 | 4.7% | 1.18% |
| 2009 | 4.72% | 1.03% |
| 2008 | 4.68% | 0.97% |
| 2007 | 4.61% | 0.99% |
| 2006 | 4.54% | 1.05% |
| 2005 | 5.27% | 1.11% |
| 2004 | 6.14% | 1.16% |
| 2003 | 6.25% | 1.24% |
| 2002 | 6.42% | 1.42% |
| 2001 | 6.62% | 1.7% |
| 2000 | 5.41% | 1.95% |
| 1999 | 4.01% | 2.1% |
| 1998 | 3.98% | 2.2% |
| 1997 | 3.94% | 2.28% |
| 1996 | 3.89% | 2.35% |
| 1995 | 3.84% | 2.42% |
| 1994 | 3.8% | 2.49% |
| 1993 | 3.77% | 2.56% |
| 1992 | 3.77% | 2.64% |
| 1991 | 3.78% | 2.69% |
| 1990 | 3.82% | 2.75% |
| 1989 | 3.9% | 2.81% |
| 1988 | 4.05% | 2.84% |
| 1987 | 4.4% | 2.86% |
| 1986 | 4.98% | 2.87% |
| 1985 | 5.66% | 2.86% |
| 1984 | 6.25% | 2.86% |
| 1983 | 6.58% | 2.85% |
| 1982 | 6.25% | 2.82% |
| 1981 | 5.06% | 2.76% |
| 1980 | 3.14% | 2.67% |
| 1979 | 1.2% | 2.58% |
| 1978 | -0.09% | 2.52% |
| 1977 | -1.51% | 2.5% |
| 1976 | -2.39% | 2.5% |
| 1975 | -2.39% | 2.51% |
| 1974 | -2.42% | 2.52% |
| 1973 | -2.32% | 2.45% |
| 1972 | -2.05% | 2.35% |
| 1971 | -1.52% | 2.28% |
| 1970 | -0.53% | 2.27% |
| 1969 | 1.15% | 2.3% |
| 1968 | 2.26% | 2.35% |
| 1967 | 2.28% | 2.41% |
| 1966 | 2.22% | 2.47% |
| 1965 | 2.16% | 2.51% |
| 1964 | 2.09% | 2.53% |
| 1963 | 2.03% | 2.47% |
| 1962 | 1.96% | 2.37% |
| 1961 | 1.89% | 2.33% |
Data sources: United Nations | World Population Prospects (2026–2100, retrieved 2026-07-08); World Bank | Health (1961–2025, retrieved 2026-07-08).
GeoRank.org/population/equatorial-guinea/paraguay | CC BY
In 2025, the population of Equatorial Guinea grew by 2.43%, while Paraguay's population grew by 1.21%.
Live population counters
|
Equatorial Guinea
|
Paraguay
|
|
|---|---|---|
| Current population |
2008950
|
7138671
|
| Population rank | 148/197 | 108/197 |
| Percent of world population | 0.02% | 0.09% |
| One net population change |
11.5 minutes
|
6.28 minutes
|
| One birth every |
9.26 minutes
|
3.84 minutes
|
| One death every |
35.4 minutes
|
13.3 minutes
|
| Daily growth/decline | +126 | +230 |
| Annual growth/decline | +45,915 | +83,925 |
| Annual growth/decline rate | +2.43% | +1.21% |
| Population growth rate rank | 29/197 | 86/197 |
| One migration net change every |
2.3 hours
|
42.4 minutes
|
| Annual migration change | +3,812 | -12,423 |
| Net migration rank | 53/196 | 137/196 |
| Foreign-born residents | 248,930 | 180,837 |
| Foreign-born residents rank | 106/195 | 119/195 |
| Foreign-born share of population | 13.2% | 2.6% |
| Foreign-born share rank | 52/195 | 123/195 |
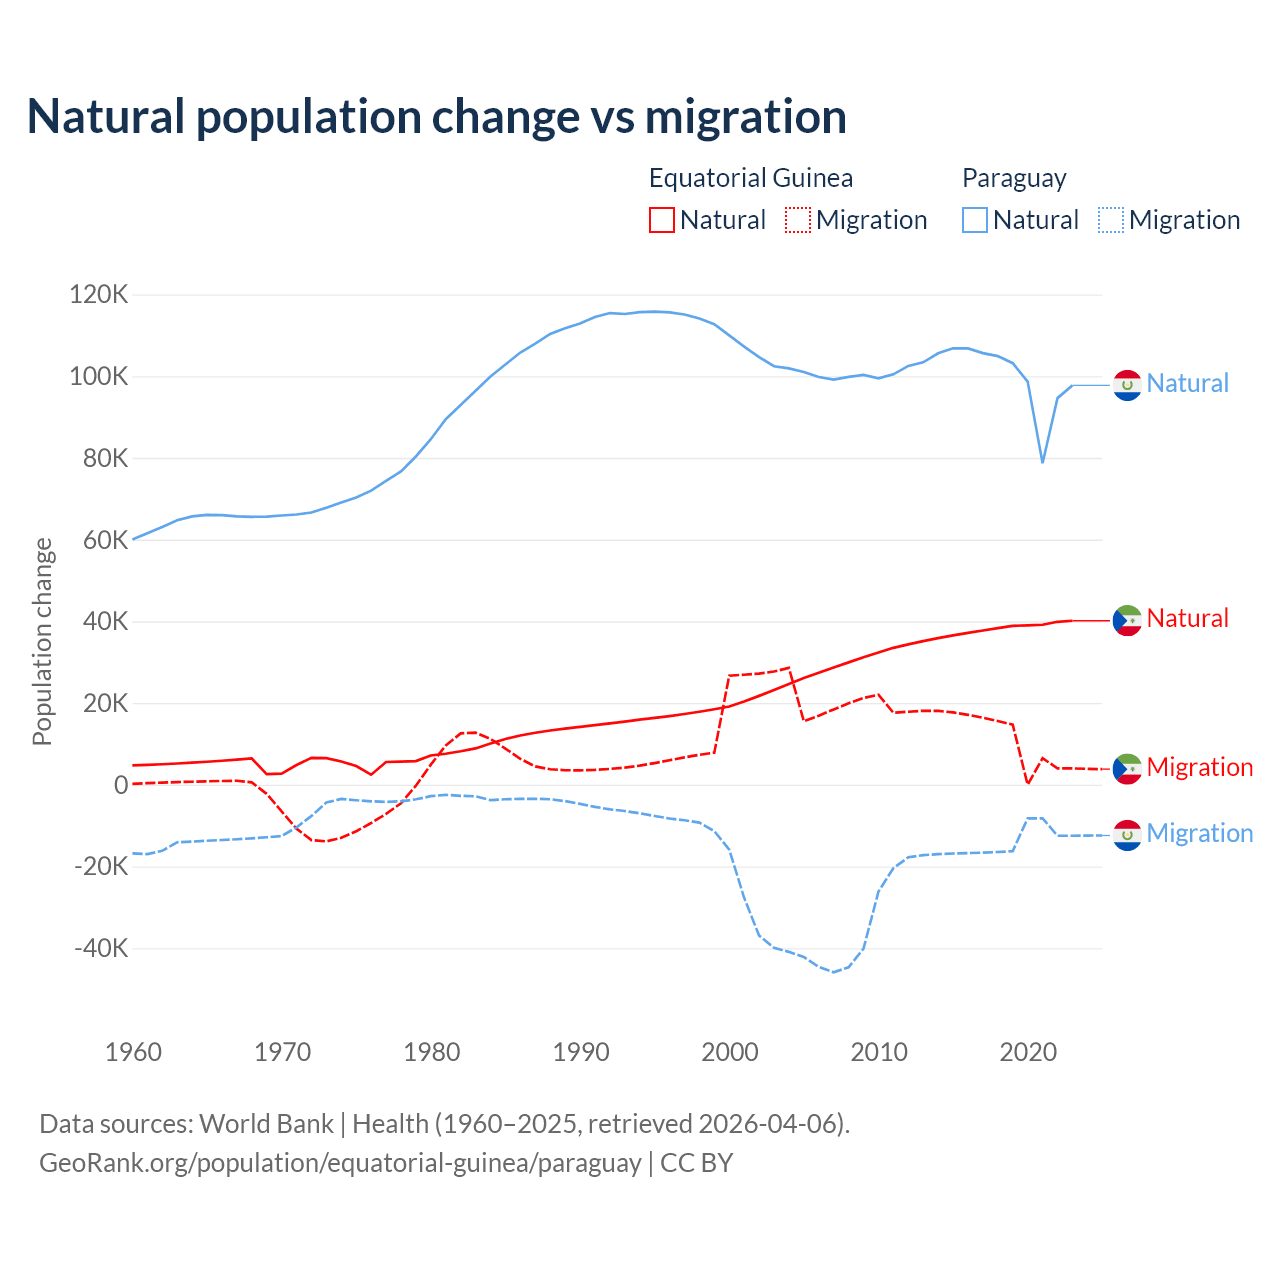
Natural population change vs migration
| Year | Population change | |||
|---|---|---|---|---|
|
Equatorial Guinea
|
Paraguay
|
|||
| Natural | Migration | Natural | Migration | |
| 2025 | - | 3,812 | - | -12,423 |
| 2024 | 41,906 | 3,891 | 97,223 | -12,451 |
| 2023 | 40,140 | 3,997 | 97,748 | -12,500 |
| 2022 | 39,873 | 3,997 | 94,627 | -12,500 |
| 2021 | 39,160 | 6,493 | 78,667 | -8,226 |
| 2020 | 38,994 | 0 | 98,667 | -8,226 |
| 2019 | 38,894 | 14,695 | 103,179 | -16,263 |
| 2018 | 38,332 | 15,581 | 104,908 | -16,472 |
| 2017 | 37,740 | 16,399 | 105,634 | -16,630 |
| 2016 | 37,180 | 17,107 | 106,804 | -16,737 |
| 2015 | 36,543 | 17,697 | 106,817 | -16,834 |
| 2014 | 35,889 | 18,058 | 105,585 | -16,989 |
| 2013 | 35,158 | 18,106 | 103,383 | -17,232 |
| 2012 | 34,347 | 17,860 | 102,508 | -17,763 |
| 2011 | 33,502 | 17,604 | 100,442 | -20,427 |
| 2010 | 32,368 | 22,027 | 99,456 | -26,169 |
| 2009 | 31,184 | 21,235 | 100,296 | -40,112 |
| 2008 | 29,941 | 19,925 | 99,821 | -44,679 |
| 2007 | 28,672 | 18,433 | 99,141 | -45,914 |
| 2006 | 27,404 | 16,889 | 99,808 | -44,568 |
| 2005 | 26,116 | 15,548 | 101,035 | -42,173 |
| 2004 | 24,666 | 28,578 | 101,896 | -40,907 |
| 2003 | 23,168 | 27,696 | 102,427 | -39,941 |
| 2002 | 21,744 | 27,198 | 104,658 | -36,918 |
| 2001 | 20,376 | 26,919 | 107,225 | -27,676 |
| 2000 | 19,132 | 26,695 | 109,979 | -15,884 |
| 1999 | 18,465 | 7,846 | 112,726 | -11,362 |
| 1998 | 17,854 | 7,307 | 114,122 | -9,276 |
| 1997 | 17,305 | 6,696 | 115,095 | -8,704 |
| 1996 | 16,802 | 6,003 | 115,623 | -8,273 |
| 1995 | 16,345 | 5,300 | 115,777 | -7,653 |
| 1994 | 15,937 | 4,664 | 115,662 | -6,999 |
| 1993 | 15,459 | 4,175 | 115,211 | -6,431 |
| 1992 | 15,010 | 3,867 | 115,442 | -6,035 |
| 1991 | 14,581 | 3,642 | 114,472 | -5,420 |
| 1990 | 14,158 | 3,511 | 112,864 | -4,685 |
| 1989 | 13,724 | 3,545 | 111,727 | -4,009 |
| 1988 | 13,266 | 3,777 | 110,348 | -3,557 |
| 1987 | 12,727 | 4,482 | 107,962 | -3,445 |
| 1986 | 12,061 | 6,317 | 105,776 | -3,460 |
| 1985 | 11,179 | 8,816 | 102,859 | -3,562 |
| 1984 | 10,076 | 11,221 | 99,937 | -3,769 |
| 1983 | 8,886 | 12,766 | 96,406 | -2,845 |
| 1982 | 8,182 | 12,568 | 92,917 | -2,725 |
| 1981 | 7,573 | 9,605 | 89,456 | -2,477 |
| 1980 | 7,142 | 4,903 | 84,568 | -2,808 |
| 1979 | 5,786 | -235 | 80,345 | -3,570 |
| 1978 | 5,635 | -4,553 | 76,691 | -4,066 |
| 1977 | 5,550 | -7,131 | 74,359 | -4,201 |
| 1976 | 2,451 | -9,377 | 71,973 | -4,066 |
| 1975 | 4,580 | -11,398 | 70,285 | -3,807 |
| 1974 | 5,697 | -12,983 | 69,059 | -3,478 |
| 1973 | 6,508 | -13,875 | 67,803 | -4,346 |
| 1972 | 6,572 | -13,576 | 66,625 | -7,642 |
| 1971 | 4,822 | -10,760 | 66,142 | -10,446 |
| 1970 | 2,715 | -6,499 | 65,905 | -12,579 |
| 1969 | 2,593 | -2,237 | 65,616 | -12,859 |
| 1968 | 6,417 | 565 | 65,575 | -13,132 |
| 1967 | 6,135 | 974 | 65,695 | -13,346 |
| 1966 | 5,868 | 915 | 66,002 | -13,538 |
| 1965 | 5,618 | 837 | 66,063 | -13,715 |
| 1964 | 5,393 | 735 | 65,681 | -13,915 |
| 1963 | 5,192 | 632 | 64,741 | -14,086 |
| 1962 | 5,013 | 528 | 63,079 | -16,175 |
| 1961 | 4,858 | 384 | 61,536 | -16,972 |
| 1960 | 4,727 | 210 | 60,009 | -16,811 |
Data sources: World Bank | Health (1960–2025, retrieved 2026-07-08).
GeoRank.org/population/equatorial-guinea/paraguay | CC BY
Over the last 10 years, 79.6% of the population change in Equatorial Guinea is from natural causes (a gain of 388,762 people) and 20.4% is from migration (a gain of 99,857 people). In Paraguay 87.9% is from natural causes (a gain of 994,274 people) and 12.1% is from migration (a loss of 136,839 people).
As of 2024, 248,930 residents or 13.2% of the population were not native-born in Equatorial Guinea, compared to 180,837 people or 2.6% in Paraguay.
Biggest cities by population
|
Equatorial Guinea
|
|
|---|---|
| City | Population |
| Malabo | 297K |
| Bata | 290K |
|
Paraguay
|
|
|---|---|
| City | Population |
| Asuncion | 462K |
| Ciudad del Este | 350K |
| Luque | 260K |
| San Lorenzo | 225K |
| Pedro Juan Caballero | 127K |
| Caaguazu | 127K |
| Encarnacion | 107K |
| Coronel Oviedo | 52.4K |
| Concepcion | 45.1K |
Compare countries by 7 more topics
Population differences between Equatorial Guinea and Paraguay
|
Equatorial Guinea
|
Paraguay
|
|
|---|---|---|
| Life expectancy | 64.3 years | 74.2 years |
| Average age | 26 years | 30.4 years |
| Median age | 22 years | 28 years |
| Male:Female ratio | 52.7:47.3 | 50.1:49.9 |
| Fertility rate | 4.12 births per woman | 2.42 births per woman |
| Population density | 183.3 ppl/mi² | 46.4 ppl/mi² |
Population map with other countries
Data sources: World Bank | Health (1960–2025, retrieved 2026-07-08); United Nations | World Population Prospects (1960–2026, retrieved 2026-07-08); U.S. Census Bureau (1960–2025, retrieved 2026-07-08); Central Intelligence Agency (CIA) (2000–2019, retrieved 2026-07-08).
GeoRank.org/population/equatorial-guinea/paraguay | CC BY
Help us show the world through your eyes
Share a photo of your city and help others discover what it looks like to live there. Your contribution makes our data come alive.
Data sources:
- World Bank | Health (1960–2025, retrieved 2026-07-08)
- United Nations | World Population Prospects (1960–2100, retrieved 2026-07-08)
- U.S. Census Bureau (1960–2025, retrieved 2026-07-08)
- Central Intelligence Agency (CIA) (2000–2019, retrieved 2026-07-08)
- Wikidata (2026, retrieved 2026-07-08)
Creative Commons Attribution (CC BY) — you’re free to copy, share, remix, adapt, and use even commercially as long as you give appropriate credit and clearly indicate if you made changes. Other sources may be subject to different license terms.