The latest officially reported population of Bolivia was 12,581,843 in 2025 vs 8,591,626 people in Togo in 2025. In 2026, based on the adjusted UN estimation, the current Bolivia's population is 12,837,312 people compared to 8,873,660 in Togo.
Population statistics:
- Bolivia's population is 1.45 times bigger than Togo's.
- Bolivia is ranked the 79th most populous country in the world, while Togo is the 102nd.
- The countries together account for 0.26% of the world: 0.15% for Bolivia vs 0.11% for Togo.
- For the last 10 years, Bolivia has had an average growth rate of +1.36% per year vs +1.96% in Togo.
- Since 2006, the population of Bolivia has increased from 9.52M people to 12.8M (34.8% growth), while Togo has grown from 5.57M to 8.87M (59.3% growth).
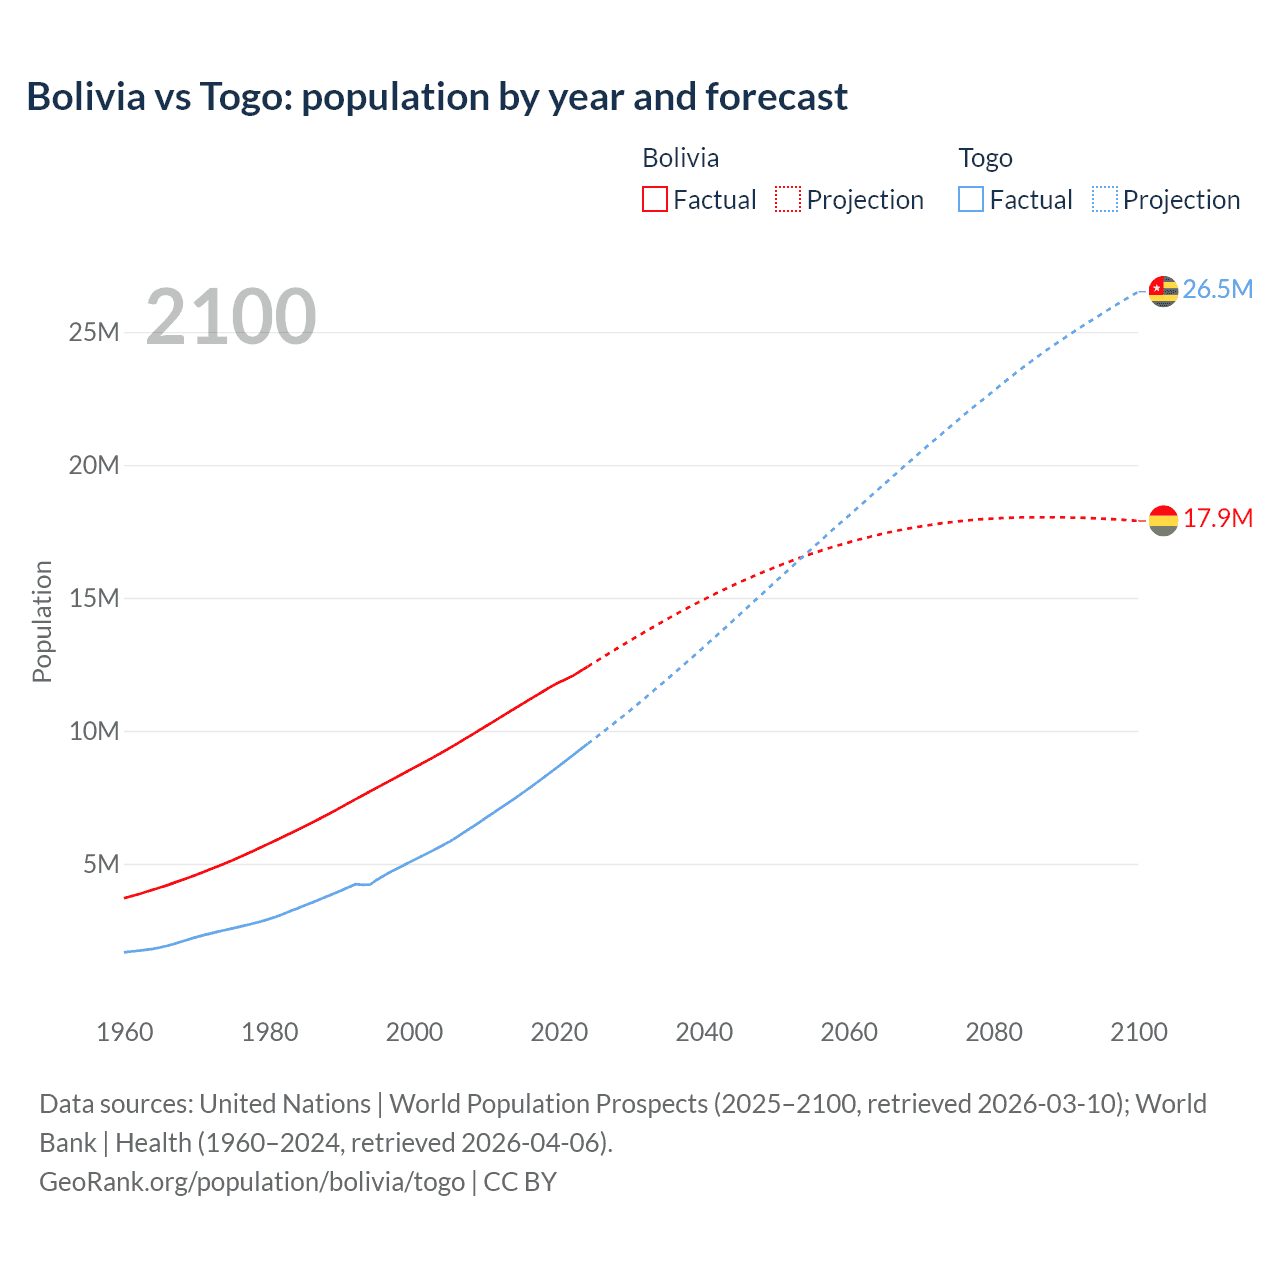
Bolivia vs Togo: population by year and forecast
| Year | Population | |
|---|---|---|
 Bolivia
|
 Togo
Togo
|
|
| 2100 | 17,891,143 | 23,426,426 |
| 2099 | 17,911,750 | 23,284,304 |
| 2098 | 17,930,833 | 23,142,242 |
| 2097 | 17,948,126 | 22,996,845 |
| 2096 | 17,963,582 | 22,848,978 |
| 2095 | 17,977,328 | 22,702,297 |
| 2094 | 17,989,016 | 22,543,427 |
| 2093 | 17,999,530 | 22,395,941 |
| 2092 | 18,008,657 | 22,243,621 |
| 2091 | 18,016,434 | 22,083,590 |
| 2090 | 18,022,288 | 21,924,631 |
| 2089 | 18,026,374 | 21,761,057 |
| 2088 | 18,028,801 | 21,592,941 |
| 2087 | 18,029,963 | 21,431,785 |
| 2086 | 18,029,143 | 21,252,236 |
| 2085 | 18,026,512 | 21,073,697 |
| 2084 | 18,021,640 | 20,894,251 |
| 2083 | 18,014,790 | 20,708,859 |
| 2082 | 18,005,874 | 20,520,204 |
| 2081 | 17,994,619 | 20,325,061 |
| 2080 | 17,980,992 | 20,126,833 |
| 2079 | 17,964,867 | 19,927,036 |
| 2078 | 17,946,132 | 19,738,820 |
| 2077 | 17,924,387 | 19,547,568 |
| 2076 | 17,899,247 | 19,348,296 |
| 2075 | 17,870,960 | 19,141,211 |
| 2074 | 17,839,807 | 18,936,045 |
| 2073 | 17,806,362 | 18,729,441 |
| 2072 | 17,769,463 | 18,525,904 |
| 2071 | 17,729,691 | 18,321,024 |
| 2070 | 17,687,278 | 18,116,069 |
| 2069 | 17,641,545 | 17,905,429 |
| 2068 | 17,592,799 | 17,689,344 |
| 2067 | 17,540,255 | 17,477,786 |
| 2066 | 17,484,401 | 17,262,406 |
| 2065 | 17,425,710 | 17,049,758 |
| 2064 | 17,363,463 | 16,836,991 |
| 2063 | 17,298,241 | 16,618,806 |
| 2062 | 17,230,131 | 16,404,475 |
| 2061 | 17,158,789 | 16,190,814 |
| 2060 | 17,084,495 | 15,976,939 |
| 2059 | 17,006,955 | 15,767,690 |
| 2058 | 16,926,185 | 15,556,151 |
| 2057 | 16,842,318 | 15,341,629 |
| 2056 | 16,755,098 | 15,125,918 |
| 2055 | 16,665,072 | 14,903,207 |
| 2054 | 16,571,285 | 14,687,272 |
| 2053 | 16,474,757 | 14,471,467 |
| 2052 | 16,374,922 | 14,253,335 |
| 2051 | 16,271,717 | 14,030,311 |
| 2050 | 16,165,260 | 13,812,790 |
| 2049 | 16,055,569 | 13,588,431 |
| 2048 | 15,942,659 | 13,367,245 |
| 2047 | 15,827,029 | 13,148,252 |
| 2046 | 15,708,231 | 12,927,000 |
| 2045 | 15,586,373 | 12,705,654 |
| 2044 | 15,461,422 | 12,484,181 |
| 2043 | 15,333,286 | 12,261,788 |
| 2042 | 15,202,151 | 12,044,285 |
| 2041 | 15,067,999 | 11,827,268 |
| 2040 | 14,931,164 | 11,614,781 |
| 2039 | 14,791,253 | 11,398,360 |
| 2038 | 14,648,198 | 11,185,757 |
| 2037 | 14,502,712 | 10,975,322 |
| 2036 | 14,354,673 | 10,767,990 |
| 2035 | 14,203,719 | 10,559,369 |
| 2034 | 14,050,157 | 10,353,764 |
| 2033 | 13,894,595 | 10,148,738 |
| 2032 | 13,736,683 | 9,944,247 |
| 2031 | 13,576,765 | 9,741,001 |
| 2030 | 13,414,644 | 9,541,309 |
| 2029 | 13,251,015 | 9,347,000 |
| 2028 | 13,085,878 | 9,155,475 |
| 2027 | 12,918,991 | 8,965,572 |
| 2026 | 12,751,046 | 8,776,585 |
| 2025 | 12,581,843 | 8,591,626 |
| 2024 | 12,413,315 | 8,406,558 |
| 2023 | 12,244,159 | 8,223,850 |
| 2022 | 12,077,154 | 8,068,616 |
| 2021 | 11,937,360 | 7,936,176 |
| 2020 | 11,816,299 | 7,788,054 |
| 2019 | 11,671,386 | 7,619,925 |
| 2018 | 11,508,368 | 7,458,206 |
| 2017 | 11,344,587 | 7,324,386 |
| 2016 | 11,180,020 | 7,200,884 |
| 2015 | 11,014,705 | 7,071,502 |
| 2014 | 10,848,888 | 6,937,644 |
| 2013 | 10,682,608 | 6,798,848 |
| 2012 | 10,515,807 | 6,653,718 |
| 2011 | 10,348,929 | 6,500,582 |
| 2010 | 10,182,345 | 6,325,788 |
| 2009 | 10,016,275 | 6,130,946 |
| 2008 | 9,850,858 | 5,936,138 |
| 2007 | 9,685,960 | 5,748,443 |
| 2006 | 9,521,689 | 5,569,664 |
| 2005 | 9,360,754 | 5,413,154 |
| 2004 | 9,204,287 | 5,281,320 |
| 2003 | 9,050,700 | 5,154,112 |
| 2002 | 8,900,355 | 5,027,130 |
| 2001 | 8,752,736 | 4,904,144 |
| 2000 | 8,606,326 | 4,783,722 |
| 1999 | 8,459,806 | 4,665,754 |
| 1998 | 8,313,394 | 4,551,635 |
| 1997 | 8,167,900 | 4,438,794 |
| 1996 | 8,021,736 | 4,291,136 |
| 1995 | 7,874,676 | 4,110,450 |
| 1994 | 7,727,322 | 3,904,183 |
| 1993 | 7,579,195 | 3,887,974 |
| 1992 | 7,430,336 | 3,932,581 |
| 1991 | 7,280,289 | 3,822,636 |
| 1990 | 7,130,142 | 3,714,021 |
| 1989 | 6,981,766 | 3,606,918 |
| 1988 | 6,835,508 | 3,501,545 |
| 1987 | 6,692,162 | 3,397,614 |
| 1986 | 6,552,479 | 3,296,340 |
| 1985 | 6,416,185 | 3,194,539 |
| 1984 | 6,281,868 | 3,105,743 |
| 1983 | 6,149,060 | 3,033,077 |
| 1982 | 6,018,088 | 2,961,652 |
| 1981 | 5,888,109 | 2,879,440 |
| 1980 | 5,758,900 | 2,791,408 |
| 1979 | 5,630,849 | 2,714,349 |
| 1978 | 5,504,123 | 2,646,501 |
| 1977 | 5,379,166 | 2,583,984 |
| 1976 | 5,256,496 | 2,523,488 |
| 1975 | 5,137,539 | 2,463,796 |
| 1974 | 5,022,475 | 2,404,292 |
| 1973 | 4,910,200 | 2,344,510 |
| 1972 | 4,800,978 | 2,283,863 |
| 1971 | 4,694,342 | 2,219,826 |
| 1970 | 4,590,010 | 2,149,478 |
| 1969 | 4,488,232 | 2,043,416 |
| 1968 | 4,388,944 | 1,953,523 |
| 1967 | 4,292,572 | 1,912,764 |
| 1966 | 4,199,550 | 1,873,489 |
| 1965 | 4,109,796 | 1,835,588 |
| 1964 | 4,022,996 | 1,799,410 |
| 1963 | 3,938,913 | 1,765,072 |
| 1962 | 3,857,493 | 1,732,959 |
| 1961 | 3,778,731 | 1,702,717 |
| 1960 | 3,702,323 | 1,673,110 |
Data sources: United Nations | World Population Prospects (2026–2100, retrieved 2026-07-08); World Bank | Health (1960–2025, retrieved 2026-07-08).
GeoRank.org/population/bolivia/togo | CC BY 
From 2006 to 2016, the population of Bolivia increased by 1,658,331 people (a 17.4% growth), while Togo gained 1,631,220 people (a 29.3% growth).
For the next 10 years, from 2016 to 2026, Bolivia gained 1,657,292 people (a 14.8% growth), while Togo's population increased by 1,672,776 people (a 23.2% growth).
Bolivia was ranked 83rd most populous country in 2006 and is 79th in 2026. Togo was ranked 106th in 2006 and ranked 102nd now.
The UN's World Population Prospects forecasts that in 24 years (in 2050) Bolivia's population will grow by 25.9% to 16,165,260 people with a rank change from 79th to 80th. The population of Togo will increase by 55.7% to 13,812,790 people and rank change from 102nd to 88th.
Bolivia is projected to reach its peak in 2087 at 18M people compared to the peak of 23.4M people in 2100 for Togo.
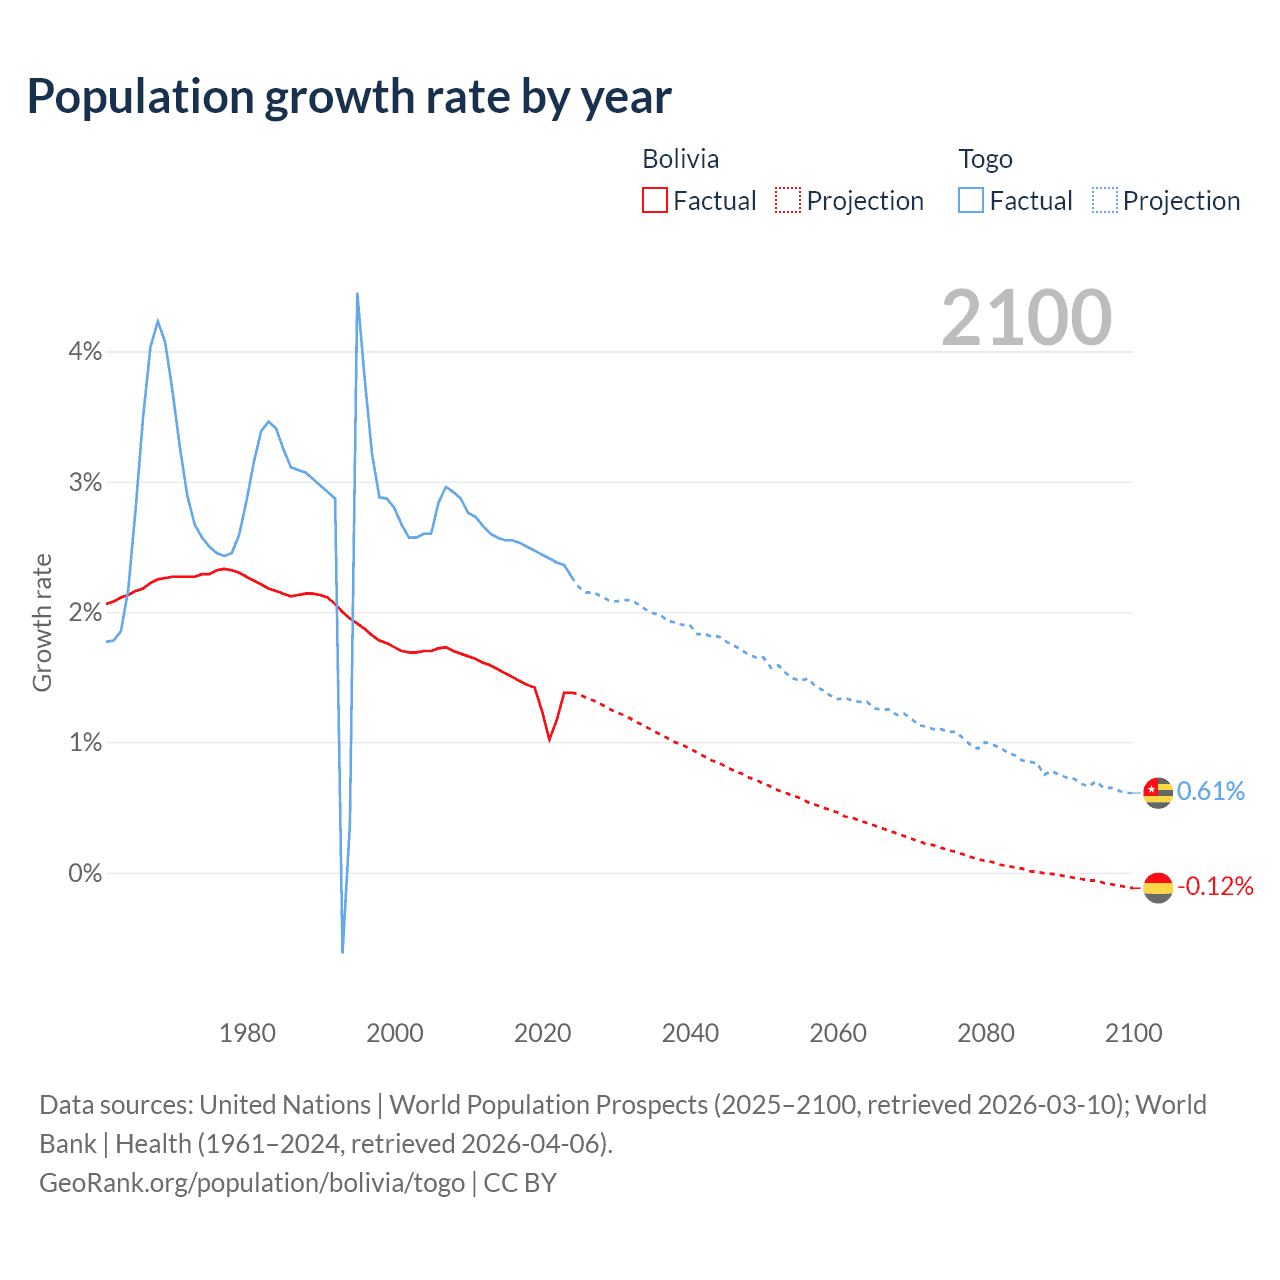
Population growth rate by year
| Year | Growth rate | |
|---|---|---|
|
Bolivia
|
Togo
|
|
| 2100 | -0.12% | 0.61% |
| 2099 | -0.11% | 0.61% |
| 2098 | -0.1% | 0.63% |
| 2097 | -0.09% | 0.65% |
| 2096 | -0.08% | 0.65% |
| 2095 | -0.06% | 0.7% |
| 2094 | -0.06% | 0.66% |
| 2093 | -0.05% | 0.68% |
| 2092 | -0.04% | 0.72% |
| 2091 | -0.03% | 0.73% |
| 2090 | -0.02% | 0.75% |
| 2089 | -0.01% | 0.78% |
| 2088 | -0.006% | 0.75% |
| 2087 | 0.005% | 0.84% |
| 2086 | 0.01% | 0.85% |
| 2085 | 0.03% | 0.86% |
| 2084 | 0.04% | 0.9% |
| 2083 | 0.05% | 0.92% |
| 2082 | 0.06% | 0.96% |
| 2081 | 0.08% | 0.98% |
| 2080 | 0.09% | 1% |
| 2079 | 0.1% | 0.95% |
| 2078 | 0.12% | 0.98% |
| 2077 | 0.14% | 1.03% |
| 2076 | 0.16% | 1.08% |
| 2075 | 0.17% | 1.08% |
| 2074 | 0.19% | 1.1% |
| 2073 | 0.21% | 1.1% |
| 2072 | 0.22% | 1.12% |
| 2071 | 0.24% | 1.13% |
| 2070 | 0.26% | 1.18% |
| 2069 | 0.28% | 1.22% |
| 2068 | 0.3% | 1.21% |
| 2067 | 0.32% | 1.25% |
| 2066 | 0.34% | 1.25% |
| 2065 | 0.36% | 1.26% |
| 2064 | 0.38% | 1.31% |
| 2063 | 0.4% | 1.31% |
| 2062 | 0.42% | 1.32% |
| 2061 | 0.43% | 1.34% |
| 2060 | 0.46% | 1.33% |
| 2059 | 0.48% | 1.36% |
| 2058 | 0.5% | 1.4% |
| 2057 | 0.52% | 1.43% |
| 2056 | 0.54% | 1.49% |
| 2055 | 0.57% | 1.47% |
| 2054 | 0.59% | 1.49% |
| 2053 | 0.61% | 1.53% |
| 2052 | 0.63% | 1.59% |
| 2051 | 0.66% | 1.57% |
| 2050 | 0.68% | 1.65% |
| 2049 | 0.71% | 1.65% |
| 2048 | 0.73% | 1.67% |
| 2047 | 0.76% | 1.71% |
| 2046 | 0.78% | 1.74% |
| 2045 | 0.81% | 1.77% |
| 2044 | 0.84% | 1.81% |
| 2043 | 0.86% | 1.81% |
| 2042 | 0.89% | 1.83% |
| 2041 | 0.92% | 1.83% |
| 2040 | 0.95% | 1.9% |
| 2039 | 0.98% | 1.9% |
| 2038 | 1% | 1.92% |
| 2037 | 1.03% | 1.93% |
| 2036 | 1.06% | 1.98% |
| 2035 | 1.09% | 1.99% |
| 2034 | 1.12% | 2.02% |
| 2033 | 1.15% | 2.06% |
| 2032 | 1.18% | 2.09% |
| 2031 | 1.21% | 2.09% |
| 2030 | 1.23% | 2.08% |
| 2029 | 1.26% | 2.09% |
| 2028 | 1.29% | 2.12% |
| 2027 | 1.32% | 2.15% |
| 2026 | 1.34% | 2.15% |
| 2025 | 1.36% | 2.2% |
| 2024 | 1.38% | 2.22% |
| 2023 | 1.38% | 1.92% |
| 2022 | 1.17% | 1.67% |
| 2021 | 1.02% | 1.9% |
| 2020 | 1.24% | 2.21% |
| 2019 | 1.42% | 2.17% |
| 2018 | 1.44% | 1.83% |
| 2017 | 1.47% | 1.72% |
| 2016 | 1.5% | 1.83% |
| 2015 | 1.53% | 1.93% |
| 2014 | 1.56% | 2.04% |
| 2013 | 1.59% | 2.18% |
| 2012 | 1.61% | 2.36% |
| 2011 | 1.64% | 2.76% |
| 2010 | 1.66% | 3.18% |
| 2009 | 1.68% | 3.28% |
| 2008 | 1.7% | 3.27% |
| 2007 | 1.73% | 3.21% |
| 2006 | 1.72% | 2.89% |
| 2005 | 1.7% | 2.5% |
| 2004 | 1.7% | 2.47% |
| 2003 | 1.69% | 2.53% |
| 2002 | 1.69% | 2.51% |
| 2001 | 1.7% | 2.52% |
| 2000 | 1.73% | 2.53% |
| 1999 | 1.76% | 2.51% |
| 1998 | 1.78% | 2.54% |
| 1997 | 1.82% | 3.44% |
| 1996 | 1.87% | 4.4% |
| 1995 | 1.91% | 5.28% |
| 1994 | 1.95% | 0.42% |
| 1993 | 2% | -1.13% |
| 1992 | 2.06% | 2.88% |
| 1991 | 2.11% | 2.92% |
| 1990 | 2.13% | 2.97% |
| 1989 | 2.14% | 3.01% |
| 1988 | 2.14% | 3.06% |
| 1987 | 2.13% | 3.07% |
| 1986 | 2.12% | 3.19% |
| 1985 | 2.14% | 2.86% |
| 1984 | 2.16% | 2.4% |
| 1983 | 2.18% | 2.41% |
| 1982 | 2.21% | 2.86% |
| 1981 | 2.24% | 3.15% |
| 1980 | 2.27% | 2.84% |
| 1979 | 2.3% | 2.56% |
| 1978 | 2.32% | 2.42% |
| 1977 | 2.33% | 2.4% |
| 1976 | 2.32% | 2.42% |
| 1975 | 2.29% | 2.47% |
| 1974 | 2.29% | 2.55% |
| 1973 | 2.27% | 2.66% |
| 1972 | 2.27% | 2.88% |
| 1971 | 2.27% | 3.27% |
| 1970 | 2.27% | 5.19% |
| 1969 | 2.26% | 4.6% |
| 1968 | 2.25% | 2.13% |
| 1967 | 2.22% | 2.1% |
| 1966 | 2.18% | 2.06% |
| 1965 | 2.16% | 2.01% |
| 1964 | 2.13% | 1.95% |
| 1963 | 2.11% | 1.85% |
| 1962 | 2.08% | 1.78% |
| 1961 | 2.06% | 1.77% |
Data sources: United Nations | World Population Prospects (2026–2100, retrieved 2026-07-08); World Bank | Health (1961–2025, retrieved 2026-07-08).
GeoRank.org/population/bolivia/togo | CC BY
In 2025, the population of Bolivia grew by 1.36%, while Togo's population grew by 2.2%.
Live population counters
|
Bolivia
|
Togo
|
|
|---|---|---|
| Current population |
12837312
|
8873660
|
| Population rank | 79/197 | 102/197 |
| Percent of world population | 0.15% | 0.11% |
| One net population change |
3.13 minutes
|
2.85 minutes
|
| One birth every |
2.01 minutes
|
1.95 minutes
|
| One death every |
5.9 minutes
|
7.37 minutes
|
| Daily growth/decline | +462 | +507 |
| Annual growth/decline | +168,528 | +185,068 |
| Annual growth/decline rate | +1.36% | +2.2% |
| Population growth rate rank | 75/197 | 39/197 |
| One migration net change every |
2.76 hours
|
35.1 minutes
|
| Annual migration change | -3,179 | -15,010 |
| Net migration rank | 110/196 | 144/196 |
| Foreign-born residents | 183,234 | 281,994 |
| Foreign-born residents rank | 118/195 | 99/195 |
| Foreign-born share of population | 1.5% | 3% |
| Foreign-born share rank | 143/195 | 117/195 |
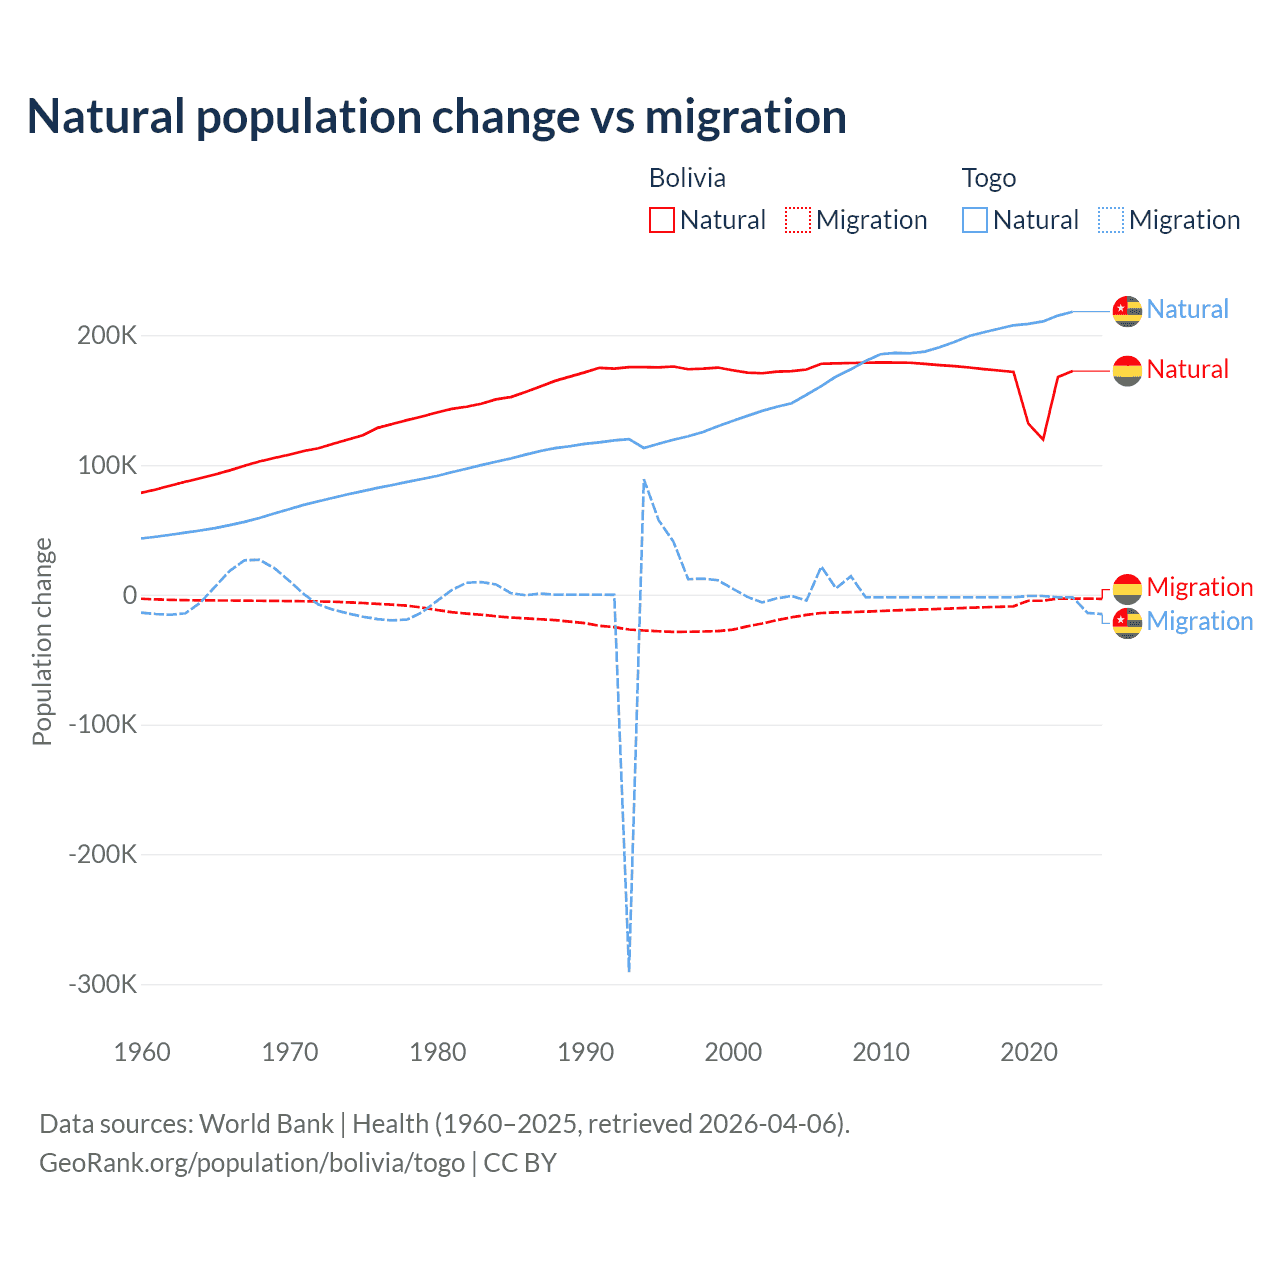
Natural population change vs migration
| Year | Population change | |||
|---|---|---|---|---|
|
Bolivia
|
Togo
|
|||
| Natural | Migration | Natural | Migration | |
| 2025 | - | -3,179 | - | -15,010 |
| 2024 | 171,974 | -3,000 | 198,184 | -14,014 |
| 2023 | 172,336 | -3,008 | 196,649 | -15,406 |
| 2022 | 167,691 | -3,008 | 195,051 | -65,826 |
| 2021 | 119,576 | -4,663 | 192,651 | -56,991 |
| 2020 | 131,870 | -4,663 | 192,474 | -31,892 |
| 2019 | 171,593 | -8,981 | 192,990 | -17,312 |
| 2018 | 172,775 | -9,344 | 191,482 | -43,718 |
| 2017 | 173,799 | -9,669 | 189,386 | -69,512 |
| 2016 | 175,057 | -10,071 | 187,007 | -59,885 |
| 2015 | 176,169 | -10,525 | 183,089 | -51,459 |
| 2014 | 176,967 | -10,971 | 179,671 | -43,591 |
| 2013 | 177,929 | -11,369 | 176,865 | -35,346 |
| 2012 | 178,716 | -11,689 | 176,051 | -27,315 |
| 2011 | 178,840 | -12,106 | 176,484 | -18,960 |
| 2010 | 179,036 | -12,590 | 175,800 | 16,265 |
| 2009 | 178,741 | -13,055 | 170,740 | 26,886 |
| 2008 | 178,576 | -13,418 | 164,627 | 27,362 |
| 2007 | 178,309 | -13,669 | 158,312 | 25,082 |
| 2006 | 177,999 | -14,107 | 150,821 | 23,346 |
| 2005 | 173,567 | -15,594 | 143,281 | -4,415 |
| 2004 | 172,350 | -17,385 | 136,802 | -11,998 |
| 2003 | 171,846 | -19,621 | 133,852 | -4,237 |
| 2002 | 170,656 | -22,188 | 130,283 | -5,939 |
| 2001 | 171,177 | -24,405 | 126,419 | -4,802 |
| 2000 | 172,996 | -26,940 | 122,712 | -3,485 |
| 1999 | 175,051 | -28,074 | 119,331 | -2,618 |
| 1998 | 174,207 | -28,378 | 116,918 | -5,394 |
| 1997 | 173,731 | -28,566 | 116,559 | -2,397 |
| 1996 | 175,861 | -28,685 | 111,887 | 69,276 |
| 1995 | 175,141 | -28,204 | 106,983 | 73,224 |
| 1994 | 175,387 | -27,621 | 100,045 | 132,276 |
| 1993 | 175,344 | -26,856 | 112,013 | -311,917 |
| 1992 | 174,242 | -25,005 | 110,828 | -132 |
| 1991 | 174,836 | -23,982 | 109,267 | -72 |
| 1990 | 171,351 | -21,917 | 107,985 | 59 |
| 1989 | 168,044 | -20,720 | 106,166 | 0 |
| 1988 | 164,763 | -19,568 | 104,605 | -29 |
| 1987 | 160,458 | -18,948 | 102,435 | 848 |
| 1986 | 156,146 | -18,297 | 99,698 | -436 |
| 1985 | 152,288 | -17,558 | 96,376 | 7,971 |
| 1984 | 150,545 | -16,625 | 95,195 | -21,949 |
| 1983 | 147,129 | -15,432 | 94,034 | -21,948 |
| 1982 | 144,825 | -14,580 | 92,715 | -21,958 |
| 1981 | 143,199 | -13,476 | 90,144 | 3,519 |
| 1980 | 140,460 | -11,762 | 87,404 | -4,993 |
| 1979 | 137,331 | -9,923 | 85,228 | -13,519 |
| 1978 | 134,504 | -8,462 | 83,151 | -19,163 |
| 1977 | 131,569 | -7,714 | 80,902 | -19,856 |
| 1976 | 128,552 | -7,063 | 78,770 | -18,832 |
| 1975 | 122,864 | -6,424 | 76,412 | -16,973 |
| 1974 | 119,560 | -5,873 | 74,055 | -14,483 |
| 1973 | 116,323 | -5,457 | 71,549 | -11,555 |
| 1972 | 112,799 | -5,224 | 68,966 | -7,661 |
| 1971 | 110,749 | -5,057 | 66,284 | 482 |
| 1970 | 107,897 | -4,915 | 63,057 | 10,865 |
| 1969 | 105,361 | -4,784 | 58,207 | 80,000 |
| 1968 | 102,671 | -4,679 | 56,082 | -14,504 |
| 1967 | 99,339 | -4,586 | 54,359 | -14,424 |
| 1966 | 95,800 | -4,507 | 52,832 | -14,216 |
| 1965 | 92,655 | -4,444 | 51,096 | -13,915 |
| 1964 | 89,745 | -4,352 | 49,450 | -14,266 |
| 1963 | 87,010 | -4,233 | 47,869 | -14,361 |
| 1962 | 84,090 | -4,026 | 46,201 | -15,486 |
| 1961 | 81,106 | -3,642 | 44,623 | -14,858 |
| 1960 | 78,501 | -3,144 | 43,307 | -13,868 |
Data sources: World Bank | Health (1960–2025, retrieved 2026-07-08).
GeoRank.org/population/bolivia/togo | CC BY
Over the last 10 years, 96.1% of the population change in Bolivia is from natural causes (a gain of 1,632,840 people) and 3.94% is from migration (a loss of 66,932 people). In Togo 81.8% is from natural causes (a gain of 1,918,963 people) and 18.2% is from migration (a loss of 426,015 people).
As of 2024, 183,234 residents or 1.5% of the population were not native-born in Bolivia, compared to 281,994 people or 3% in Togo.
Biggest cities by population
Compare countries by 7 more topics
Population differences between Bolivia and Togo
|
Bolivia
|
Togo
|
|
|---|---|---|
| Life expectancy | 69.1 years | 63.3 years |
| Average age | 29.2 years | 24.2 years |
| Median age | 26.2 years | 19.4 years |
| Male:Female ratio | 50.1:49.9 | 48.9:51.1 |
| Fertility rate | 2.52 births per woman | 4.12 births per woman |
| Population density | 30.5 ppl/mi² | 418 ppl/mi² |
Population map with other countries
Data sources: World Bank | Health (1960–2025, retrieved 2026-07-08); United Nations | World Population Prospects (1960–2026, retrieved 2026-07-08); U.S. Census Bureau (1960–2025, retrieved 2026-07-08); Central Intelligence Agency (CIA) (2000–2019, retrieved 2026-07-08).
GeoRank.org/population/bolivia/togo | CC BY
Help us show the world through your eyes
Share a photo of your city and help others discover what it looks like to live there. Your contribution makes our data come alive.
Data sources:
- World Bank | Health (1960–2025, retrieved 2026-07-08)
- United Nations | World Population Prospects (1960–2100, retrieved 2026-07-08)
- U.S. Census Bureau (1960–2025, retrieved 2026-07-08)
- Central Intelligence Agency (CIA) (2000–2019, retrieved 2026-07-08)
- Wikidata (2026, retrieved 2026-07-08)
Creative Commons Attribution (CC BY) — you’re free to copy, share, remix, adapt, and use even commercially as long as you give appropriate credit and clearly indicate if you made changes. Other sources may be subject to different license terms.