The latest officially reported population of Lesotho was 2,363,325 in 2025 vs 1,367,764 people in Trinidad and Tobago in 2025. In 2026, based on the adjusted UN estimation, the current Lesotho's population is 2,402,837 people compared to 1,370,916 in Trinidad and Tobago.
Population statistics:
- Lesotho's population is 1.75 times bigger than Trinidad and Tobago's.
- Lesotho is ranked the 143rd most populous country in the world, while Trinidad and Tobago is the 154th.
- The countries together account for 0.05% of the world: 0.03% for Lesotho vs 0.02% for Trinidad and Tobago.
- For the last 10 years, Lesotho has had an average growth rate of +1.17% per year vs +0.15% in Trinidad and Tobago.
- Since 2006, the population of Lesotho has increased from 1.95M people to 2.4M (23.5% growth), while Trinidad and Tobago has grown from 1.3M to 1.37M (5.62% growth).
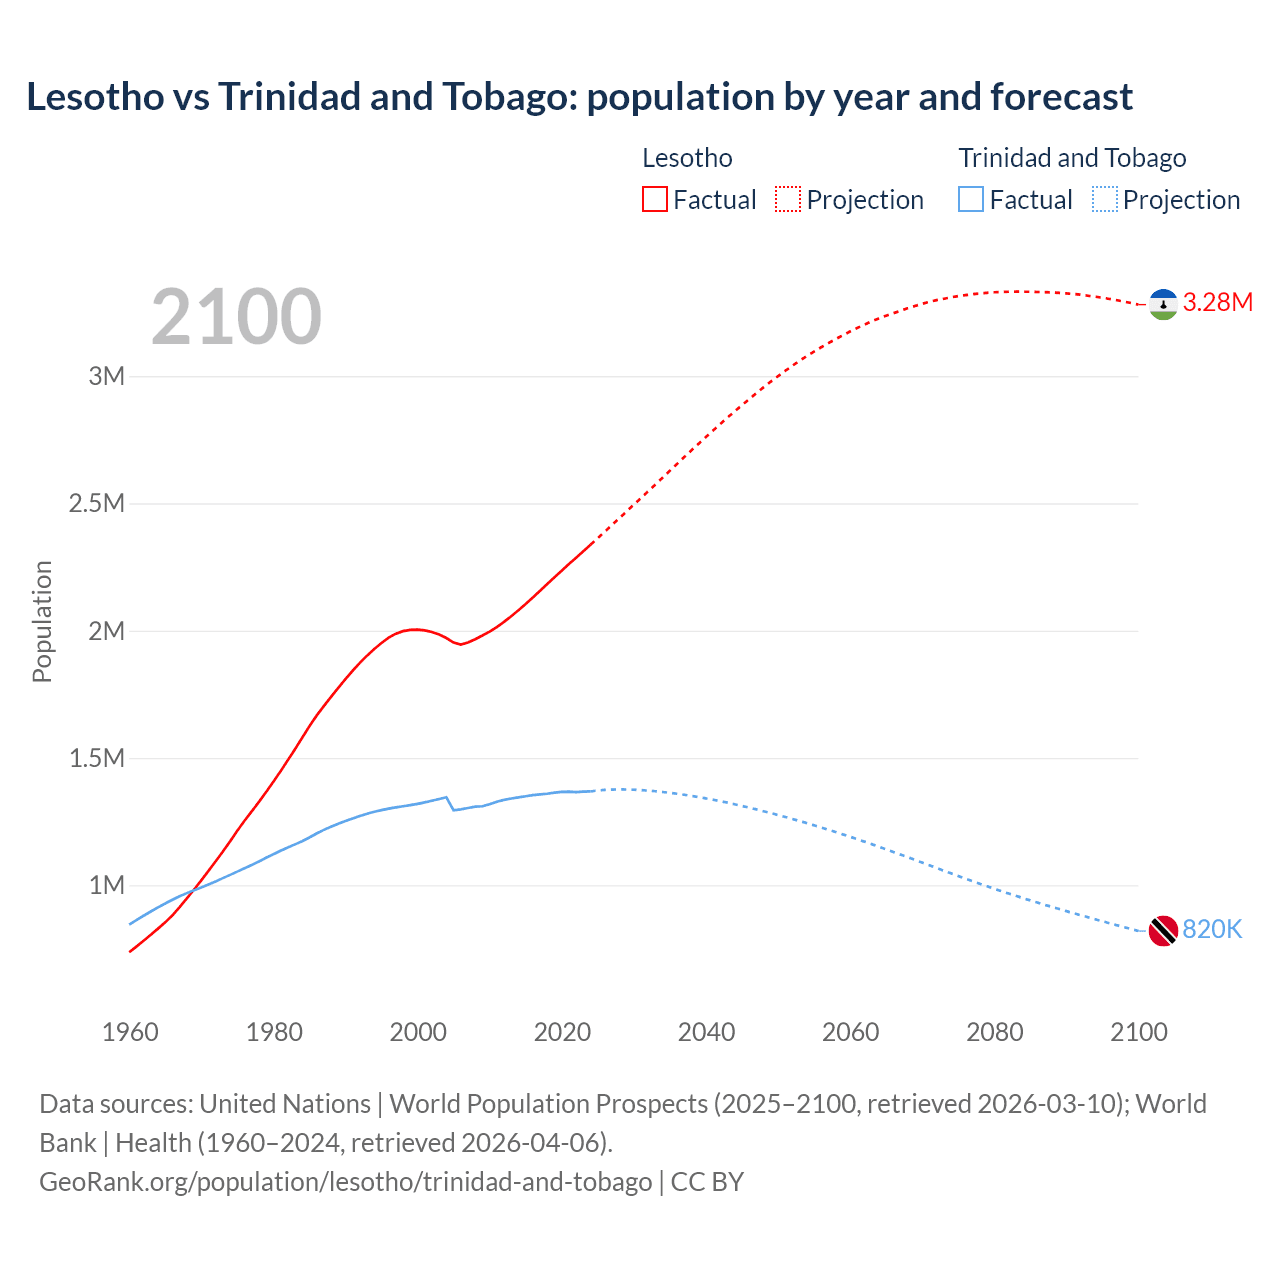
Lesotho vs Trinidad and Tobago: population by year and forecast
| Year | Population | |
|---|---|---|
 Lesotho
|
 Trinidad
|
|
| 2100 | 3,280,518 | 817,597 |
| 2099 | 3,286,430 | 825,167 |
| 2098 | 3,292,231 | 832,755 |
| 2097 | 3,297,835 | 840,398 |
| 2096 | 3,302,758 | 848,105 |
| 2095 | 3,307,678 | 855,896 |
| 2094 | 3,311,734 | 863,688 |
| 2093 | 3,315,488 | 871,563 |
| 2092 | 3,319,391 | 879,479 |
| 2091 | 3,322,303 | 887,507 |
| 2090 | 3,324,499 | 895,594 |
| 2089 | 3,326,577 | 903,792 |
| 2088 | 3,328,210 | 912,036 |
| 2087 | 3,329,694 | 920,411 |
| 2086 | 3,330,185 | 928,916 |
| 2085 | 3,330,989 | 937,549 |
| 2084 | 3,331,214 | 946,328 |
| 2083 | 3,331,221 | 955,303 |
| 2082 | 3,330,964 | 964,428 |
| 2081 | 3,330,141 | 973,767 |
| 2080 | 3,328,997 | 983,215 |
| 2079 | 3,326,895 | 992,890 |
| 2078 | 3,324,376 | 1,002,707 |
| 2077 | 3,321,152 | 1,012,724 |
| 2076 | 3,317,581 | 1,022,846 |
| 2075 | 3,313,968 | 1,033,103 |
| 2074 | 3,308,905 | 1,043,451 |
| 2073 | 3,303,592 | 1,053,862 |
| 2072 | 3,297,913 | 1,064,397 |
| 2071 | 3,291,224 | 1,074,937 |
| 2070 | 3,283,387 | 1,085,508 |
| 2069 | 3,274,978 | 1,096,081 |
| 2068 | 3,265,887 | 1,106,619 |
| 2067 | 3,256,362 | 1,117,029 |
| 2066 | 3,246,639 | 1,127,377 |
| 2065 | 3,236,890 | 1,137,666 |
| 2064 | 3,226,227 | 1,147,820 |
| 2063 | 3,214,843 | 1,157,795 |
| 2062 | 3,202,027 | 1,167,602 |
| 2061 | 3,188,674 | 1,177,258 |
| 2060 | 3,174,740 | 1,186,727 |
| 2059 | 3,159,947 | 1,196,052 |
| 2058 | 3,144,797 | 1,205,157 |
| 2057 | 3,129,007 | 1,214,148 |
| 2056 | 3,112,877 | 1,222,923 |
| 2055 | 3,095,653 | 1,231,559 |
| 2054 | 3,078,317 | 1,240,041 |
| 2053 | 3,059,904 | 1,248,279 |
| 2052 | 3,040,402 | 1,256,354 |
| 2051 | 3,019,864 | 1,264,264 |
| 2050 | 2,999,214 | 1,271,946 |
| 2049 | 2,977,795 | 1,279,479 |
| 2048 | 2,955,487 | 1,286,792 |
| 2047 | 2,932,450 | 1,293,925 |
| 2046 | 2,909,071 | 1,300,799 |
| 2045 | 2,885,303 | 1,307,495 |
| 2044 | 2,861,140 | 1,313,930 |
| 2043 | 2,836,547 | 1,320,145 |
| 2042 | 2,811,435 | 1,326,058 |
| 2041 | 2,785,921 | 1,331,703 |
| 2040 | 2,760,167 | 1,337,031 |
| 2039 | 2,734,178 | 1,342,067 |
| 2038 | 2,707,996 | 1,346,734 |
| 2037 | 2,681,646 | 1,351,096 |
| 2036 | 2,654,540 | 1,355,110 |
| 2035 | 2,627,488 | 1,358,761 |
| 2034 | 2,600,669 | 1,362,044 |
| 2033 | 2,573,856 | 1,364,882 |
| 2032 | 2,547,137 | 1,367,356 |
| 2031 | 2,520,626 | 1,369,304 |
| 2030 | 2,494,444 | 1,370,777 |
| 2029 | 2,468,067 | 1,371,753 |
| 2028 | 2,441,673 | 1,372,048 |
| 2027 | 2,415,634 | 1,371,592 |
| 2026 | 2,389,322 | 1,370,204 |
| 2025 | 2,363,325 | 1,367,764 |
| 2024 | 2,337,423 | 1,368,333 |
| 2023 | 2,311,472 | 1,367,510 |
| 2022 | 2,286,110 | 1,365,805 |
| 2021 | 2,261,542 | 1,367,558 |
| 2020 | 2,235,727 | 1,366,725 |
| 2019 | 2,209,405 | 1,363,985 |
| 2018 | 2,183,603 | 1,359,193 |
| 2017 | 2,157,110 | 1,356,633 |
| 2016 | 2,130,422 | 1,353,895 |
| 2015 | 2,104,611 | 1,349,667 |
| 2014 | 2,080,089 | 1,345,343 |
| 2013 | 2,056,504 | 1,340,557 |
| 2012 | 2,034,354 | 1,335,194 |
| 2011 | 2,014,009 | 1,328,019 |
| 2010 | 1,996,251 | 1,317,714 |
| 2009 | 1,980,883 | 1,310,106 |
| 2008 | 1,966,541 | 1,308,587 |
| 2007 | 1,953,268 | 1,303,188 |
| 2006 | 1,945,063 | 1,297,944 |
| 2005 | 1,953,076 | 1,294,494 |
| 2004 | 1,971,129 | 1,345,380 |
| 2003 | 1,985,059 | 1,338,709 |
| 2002 | 1,994,679 | 1,332,011 |
| 2001 | 2,000,853 | 1,325,567 |
| 2000 | 2,003,913 | 1,319,774 |
| 1999 | 2,003,234 | 1,314,708 |
| 1998 | 1,998,049 | 1,310,225 |
| 1997 | 1,988,130 | 1,305,836 |
| 1996 | 1,972,418 | 1,300,928 |
| 1995 | 1,951,437 | 1,295,169 |
| 1994 | 1,927,707 | 1,288,341 |
| 1993 | 1,901,793 | 1,280,466 |
| 1992 | 1,873,274 | 1,271,674 |
| 1991 | 1,842,379 | 1,262,171 |
| 1990 | 1,809,696 | 1,252,208 |
| 1989 | 1,775,436 | 1,241,600 |
| 1988 | 1,739,841 | 1,230,069 |
| 1987 | 1,703,390 | 1,217,364 |
| 1986 | 1,666,138 | 1,203,124 |
| 1985 | 1,624,379 | 1,187,366 |
| 1984 | 1,578,986 | 1,172,984 |
| 1983 | 1,534,413 | 1,160,534 |
| 1982 | 1,490,732 | 1,147,927 |
| 1981 | 1,448,069 | 1,135,132 |
| 1980 | 1,406,521 | 1,121,744 |
| 1979 | 1,366,169 | 1,107,639 |
| 1978 | 1,327,240 | 1,093,380 |
| 1977 | 1,289,967 | 1,079,554 |
| 1976 | 1,253,214 | 1,066,311 |
| 1975 | 1,213,643 | 1,053,469 |
| 1974 | 1,172,420 | 1,040,761 |
| 1973 | 1,132,697 | 1,027,851 |
| 1972 | 1,094,063 | 1,014,921 |
| 1971 | 1,056,246 | 1,002,585 |
| 1970 | 1,019,273 | 991,471 |
| 1969 | 983,202 | 980,706 |
| 1968 | 948,105 | 969,006 |
| 1967 | 913,982 | 956,418 |
| 1966 | 881,870 | 942,937 |
| 1965 | 854,090 | 928,425 |
| 1964 | 829,437 | 912,963 |
| 1963 | 805,373 | 896,804 |
| 1962 | 781,814 | 880,194 |
| 1961 | 758,824 | 863,144 |
| 1960 | 736,500 | 844,943 |
Data sources: United Nations | World Population Prospects (2026–2100, retrieved 2026-07-08); World Bank | Health (1960–2025, retrieved 2026-07-08).
GeoRank.org/population/lesotho/trinidad-and-tobago | CC BY 
From 2006 to 2016, the population of Lesotho increased by 185,359 people (a 9.53% growth), while Trinidad and Tobago gained 55,951 people (a 4.31% growth).
For the next 10 years, from 2016 to 2026, Lesotho gained 272,415 people (a 12.8% growth), while Trinidad and Tobago's population increased by 17,021 people (a 1.26% growth).
Lesotho was ranked 144th most populous country in 2006 and is 143rd in 2026. Trinidad and Tobago was ranked 150th in 2006 and ranked 154th now.
The UN's World Population Prospects forecasts that in 24 years (in 2050) Lesotho's population will grow by 24.8% to 2,999,214 people with a rank change from 143rd to 141st. The population of Trinidad and Tobago will decrease by 7.22% to 1,271,946 people and rank change from 154th to 158th.
Lesotho is projected to reach its peak in 2083 at 3.33M people compared to the peak of 1.37M people in 2028 for Trinidad and Tobago.
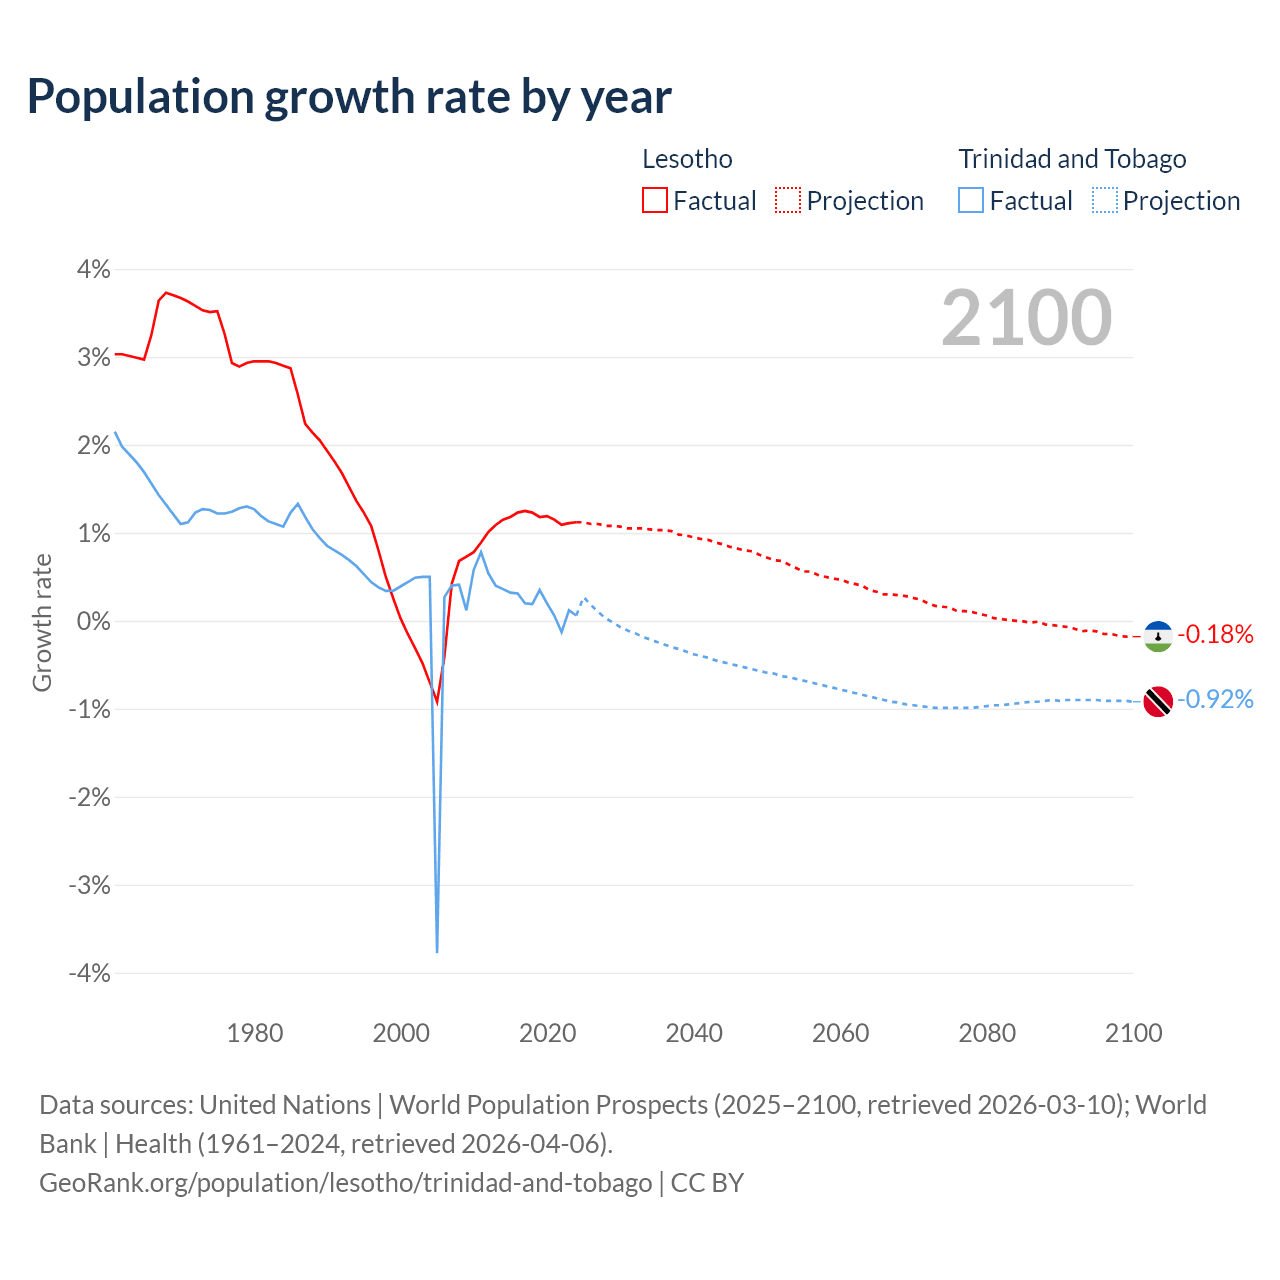
Population growth rate by year
| Year | Growth rate | |
|---|---|---|
|
Lesotho
|
Trinidad
|
|
| 2100 | -0.18% | -0.92% |
| 2099 | -0.18% | -0.91% |
| 2098 | -0.17% | -0.91% |
| 2097 | -0.15% | -0.91% |
| 2096 | -0.15% | -0.91% |
| 2095 | -0.12% | -0.9% |
| 2094 | -0.11% | -0.9% |
| 2093 | -0.12% | -0.9% |
| 2092 | -0.09% | -0.9% |
| 2091 | -0.07% | -0.9% |
| 2090 | -0.06% | -0.91% |
| 2089 | -0.05% | -0.9% |
| 2088 | -0.04% | -0.91% |
| 2087 | -0.01% | -0.92% |
| 2086 | -0.02% | -0.92% |
| 2085 | -0.007% | -0.93% |
| 2084 | -0% | -0.94% |
| 2083 | 0.008% | -0.95% |
| 2082 | 0.02% | -0.96% |
| 2081 | 0.03% | -0.96% |
| 2080 | 0.06% | -0.97% |
| 2079 | 0.08% | -0.98% |
| 2078 | 0.1% | -0.99% |
| 2077 | 0.11% | -0.99% |
| 2076 | 0.11% | -0.99% |
| 2075 | 0.15% | -0.99% |
| 2074 | 0.16% | -0.99% |
| 2073 | 0.17% | -0.99% |
| 2072 | 0.2% | -0.98% |
| 2071 | 0.24% | -0.97% |
| 2070 | 0.26% | -0.96% |
| 2069 | 0.28% | -0.95% |
| 2068 | 0.29% | -0.93% |
| 2067 | 0.3% | -0.92% |
| 2066 | 0.3% | -0.9% |
| 2065 | 0.33% | -0.88% |
| 2064 | 0.35% | -0.86% |
| 2063 | 0.4% | -0.84% |
| 2062 | 0.42% | -0.82% |
| 2061 | 0.44% | -0.8% |
| 2060 | 0.47% | -0.78% |
| 2059 | 0.48% | -0.76% |
| 2058 | 0.5% | -0.74% |
| 2057 | 0.52% | -0.72% |
| 2056 | 0.56% | -0.7% |
| 2055 | 0.56% | -0.68% |
| 2054 | 0.6% | -0.66% |
| 2053 | 0.64% | -0.64% |
| 2052 | 0.68% | -0.63% |
| 2051 | 0.69% | -0.6% |
| 2050 | 0.72% | -0.59% |
| 2049 | 0.75% | -0.57% |
| 2048 | 0.79% | -0.55% |
| 2047 | 0.8% | -0.53% |
| 2046 | 0.82% | -0.51% |
| 2045 | 0.84% | -0.49% |
| 2044 | 0.87% | -0.47% |
| 2043 | 0.89% | -0.45% |
| 2042 | 0.92% | -0.42% |
| 2041 | 0.93% | -0.4% |
| 2040 | 0.95% | -0.38% |
| 2039 | 0.97% | -0.35% |
| 2038 | 0.98% | -0.32% |
| 2037 | 1.02% | -0.3% |
| 2036 | 1.03% | -0.27% |
| 2035 | 1.03% | -0.24% |
| 2034 | 1.04% | -0.21% |
| 2033 | 1.05% | -0.18% |
| 2032 | 1.05% | -0.14% |
| 2031 | 1.05% | -0.11% |
| 2030 | 1.07% | -0.07% |
| 2029 | 1.08% | -0.02% |
| 2028 | 1.08% | 0.03% |
| 2027 | 1.1% | 0.1% |
| 2026 | 1.1% | 0.18% |
| 2025 | 1.11% | -0.04% |
| 2024 | 1.12% | 0.06% |
| 2023 | 1.11% | 0.12% |
| 2022 | 1.09% | -0.13% |
| 2021 | 1.15% | 0.06% |
| 2020 | 1.19% | 0.2% |
| 2019 | 1.18% | 0.35% |
| 2018 | 1.23% | 0.19% |
| 2017 | 1.25% | 0.2% |
| 2016 | 1.23% | 0.31% |
| 2015 | 1.18% | 0.32% |
| 2014 | 1.15% | 0.36% |
| 2013 | 1.09% | 0.4% |
| 2012 | 1.01% | 0.54% |
| 2011 | 0.89% | 0.78% |
| 2010 | 0.78% | 0.58% |
| 2009 | 0.73% | 0.12% |
| 2008 | 0.68% | 0.41% |
| 2007 | 0.42% | 0.4% |
| 2006 | -0.41% | 0.27% |
| 2005 | -0.92% | -3.78% |
| 2004 | -0.7% | 0.5% |
| 2003 | -0.48% | 0.5% |
| 2002 | -0.31% | 0.49% |
| 2001 | -0.15% | 0.44% |
| 2000 | 0.03% | 0.39% |
| 1999 | 0.26% | 0.34% |
| 1998 | 0.5% | 0.34% |
| 1997 | 0.8% | 0.38% |
| 1996 | 1.08% | 0.44% |
| 1995 | 1.23% | 0.53% |
| 1994 | 1.36% | 0.62% |
| 1993 | 1.52% | 0.69% |
| 1992 | 1.68% | 0.75% |
| 1991 | 1.81% | 0.8% |
| 1990 | 1.93% | 0.85% |
| 1989 | 2.05% | 0.94% |
| 1988 | 2.14% | 1.04% |
| 1987 | 2.24% | 1.18% |
| 1986 | 2.57% | 1.33% |
| 1985 | 2.87% | 1.23% |
| 1984 | 2.9% | 1.07% |
| 1983 | 2.93% | 1.1% |
| 1982 | 2.95% | 1.13% |
| 1981 | 2.95% | 1.19% |
| 1980 | 2.95% | 1.27% |
| 1979 | 2.93% | 1.3% |
| 1978 | 2.89% | 1.28% |
| 1977 | 2.93% | 1.24% |
| 1976 | 3.26% | 1.22% |
| 1975 | 3.52% | 1.22% |
| 1974 | 3.51% | 1.26% |
| 1973 | 3.53% | 1.27% |
| 1972 | 3.58% | 1.23% |
| 1971 | 3.63% | 1.12% |
| 1970 | 3.67% | 1.1% |
| 1969 | 3.7% | 1.21% |
| 1968 | 3.73% | 1.32% |
| 1967 | 3.64% | 1.43% |
| 1966 | 3.25% | 1.56% |
| 1965 | 2.97% | 1.69% |
| 1964 | 2.99% | 1.8% |
| 1963 | 3.01% | 1.89% |
| 1962 | 3.03% | 1.98% |
| 1961 | 3.03% | 2.15% |
Data sources: United Nations | World Population Prospects (2026–2100, retrieved 2026-07-08); World Bank | Health (1961–2025, retrieved 2026-07-08).
GeoRank.org/population/lesotho/trinidad-and-tobago | CC BY
In 2025, the population of Lesotho grew by 1.11%, while Trinidad and Tobago's population declined by 0.04%.
Live population counters
|
Lesotho
|
Trinidad
|
|
|---|---|---|
| Current population |
2402837
|
1370916
|
| Population rank | 143/197 | 154/197 |
| Percent of world population | 0.03% | 0.02% |
| One net population change |
20.3 minutes
|
15.4 hours
|
| One birth every |
9.46 minutes
|
36.4 minutes
|
| One death every |
21.5 minutes
|
44 minutes
|
| Daily growth/decline | +71 | -2 |
| Annual growth/decline | +25,902 | -569 |
| Annual growth/decline rate | +1.11% | -0.04% |
| Population growth rate rank | 94/197 | 160/197 |
| One migration net change every |
1.69 hours
|
12.7 hours
|
| Annual migration change | -5,192 | +691 |
| Net migration rank | 117/196 | 67/196 |
| Foreign-born residents | 15,039 | 113,478 |
| Foreign-born residents rank | 173/195 | 128/195 |
| Foreign-born share of population | 0.6% | 7.5% |
| Foreign-born share rank | 170/195 | 78/195 |
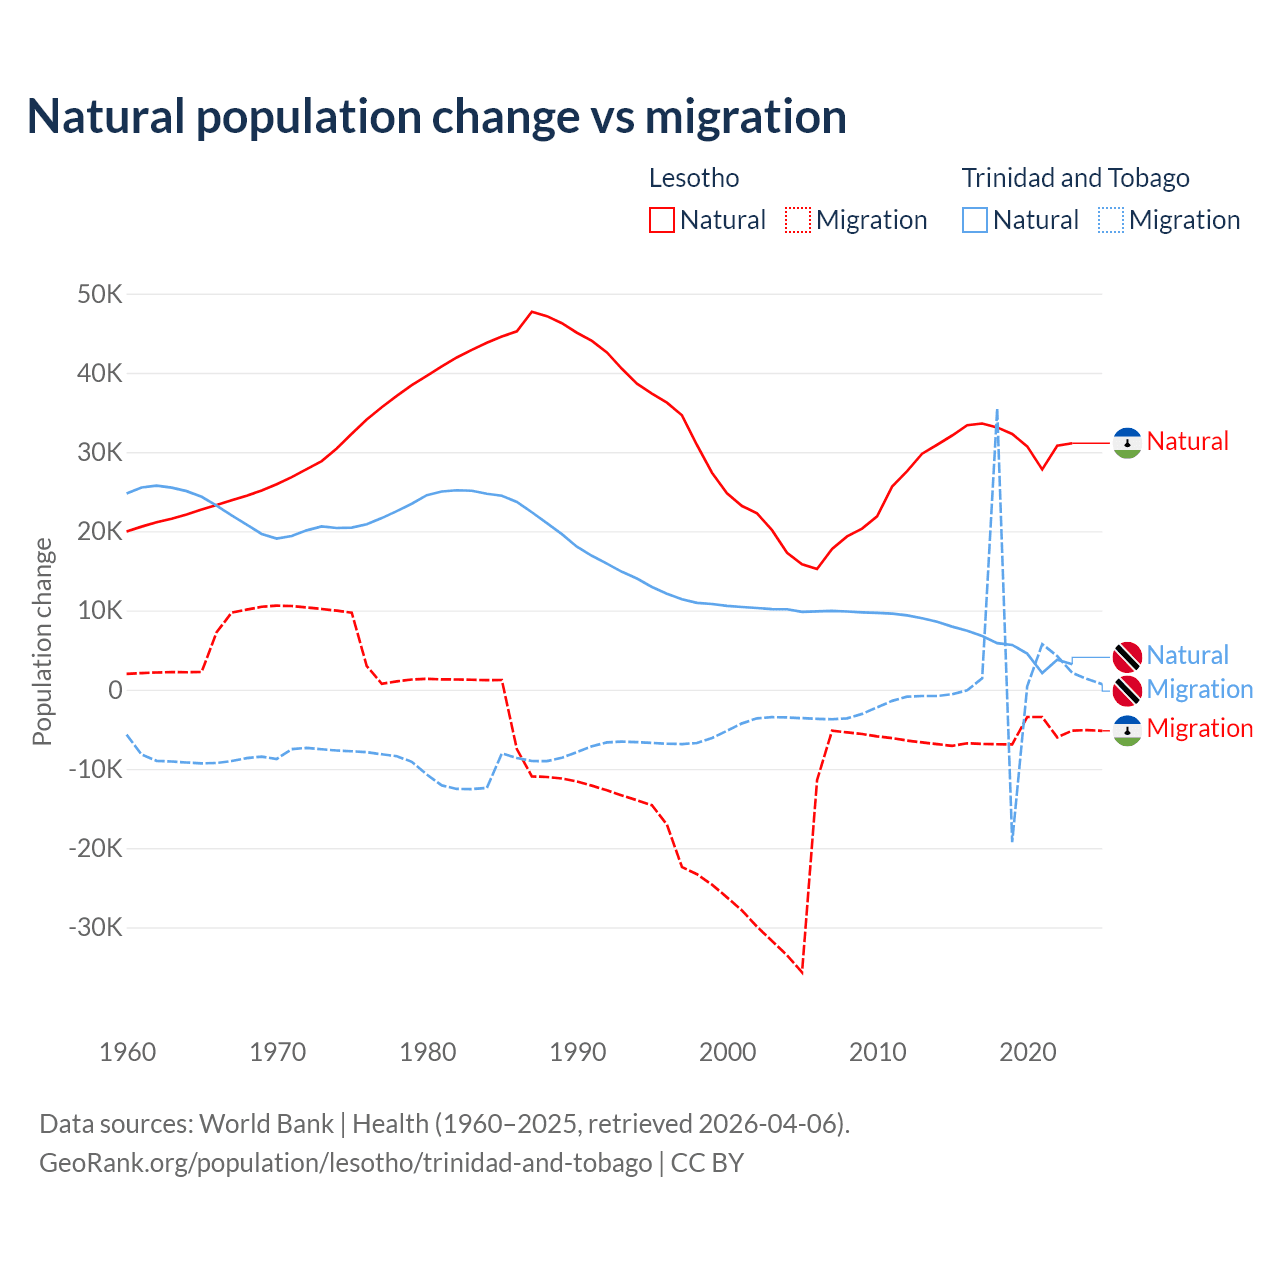
Natural population change vs migration
| Year | Population change | |||
|---|---|---|---|---|
|
Lesotho
|
Trinidad
|
|||
| Natural | Migration | Natural | Migration | |
| 2025 | - | -5,192 | - | 691 |
| 2024 | 31,050 | -5,107 | 2,469 | 1,334 |
| 2023 | 31,115 | -5,168 | 3,200 | 2,126 |
| 2022 | 30,803 | -6,023 | 3,773 | 4,247 |
| 2021 | 27,806 | -3,449 | 2,091 | 5,749 |
| 2020 | 30,721 | -3,449 | 4,558 | 427 |
| 2019 | 32,279 | -6,896 | 5,647 | -19,251 |
| 2018 | 33,112 | -6,892 | 5,869 | 35,502 |
| 2017 | 33,601 | -6,850 | 6,779 | 1,445 |
| 2016 | 33,390 | -6,766 | 7,436 | -86 |
| 2015 | 32,087 | -7,087 | 7,963 | -575 |
| 2014 | 30,922 | -6,877 | 8,571 | -799 |
| 2013 | 29,789 | -6,659 | 9,020 | -796 |
| 2012 | 27,592 | -6,425 | 9,376 | -880 |
| 2011 | 25,647 | -6,118 | 9,601 | -1,410 |
| 2010 | 21,877 | -5,886 | 9,698 | -2,230 |
| 2009 | 20,335 | -5,599 | 9,769 | -3,056 |
| 2008 | 19,349 | -5,392 | 9,872 | -3,624 |
| 2007 | 17,763 | -5,179 | 9,939 | -3,731 |
| 2006 | 15,234 | -11,416 | 9,889 | -3,684 |
| 2005 | 15,831 | -35,679 | 9,822 | -3,595 |
| 2004 | 17,271 | -33,530 | 10,149 | -3,504 |
| 2003 | 20,133 | -31,723 | 10,169 | -3,472 |
| 2002 | 22,274 | -29,924 | 10,316 | -3,613 |
| 2001 | 23,190 | -27,874 | 10,438 | -4,252 |
| 2000 | 24,786 | -26,220 | 10,588 | -5,185 |
| 1999 | 27,393 | -24,610 | 10,821 | -6,103 |
| 1998 | 30,889 | -23,299 | 10,964 | -6,730 |
| 1997 | 34,637 | -22,396 | 11,405 | -6,865 |
| 1996 | 36,228 | -17,042 | 12,101 | -6,827 |
| 1995 | 37,370 | -14,588 | 12,971 | -6,723 |
| 1994 | 38,629 | -13,953 | 14,032 | -6,615 |
| 1993 | 40,505 | -13,347 | 14,878 | -6,554 |
| 1992 | 42,579 | -12,707 | 15,910 | -6,650 |
| 1991 | 44,026 | -12,114 | 16,903 | -7,149 |
| 1990 | 45,060 | -11,598 | 18,052 | -7,878 |
| 1989 | 46,264 | -11,207 | 19,636 | -8,588 |
| 1988 | 47,158 | -11,028 | 21,028 | -9,023 |
| 1987 | 47,718 | -10,946 | 22,398 | -9,002 |
| 1986 | 45,232 | -7,501 | 23,705 | -8,620 |
| 1985 | 44,575 | 1,222 | 24,487 | -8,051 |
| 1984 | 43,785 | 1,199 | 24,738 | -12,413 |
| 1983 | 42,899 | 1,253 | 25,118 | -12,544 |
| 1982 | 41,941 | 1,281 | 25,181 | -12,529 |
| 1981 | 40,808 | 1,307 | 25,015 | -12,086 |
| 1980 | 39,617 | 1,361 | 24,557 | -10,709 |
| 1979 | 38,440 | 1,285 | 23,475 | -9,106 |
| 1978 | 37,084 | 1,047 | 22,538 | -8,397 |
| 1977 | 35,654 | 746 | 21,660 | -8,154 |
| 1976 | 34,117 | 2,986 | 20,875 | -7,895 |
| 1975 | 32,311 | 9,723 | 20,468 | -7,768 |
| 1974 | 30,444 | 9,972 | 20,412 | -7,683 |
| 1973 | 28,859 | 10,183 | 20,617 | -7,524 |
| 1972 | 27,841 | 10,386 | 20,116 | -7,346 |
| 1971 | 26,838 | 10,563 | 19,400 | -7,499 |
| 1970 | 25,935 | 10,605 | 19,074 | -8,751 |
| 1969 | 25,137 | 10,465 | 19,652 | -8,449 |
| 1968 | 24,490 | 10,108 | 20,849 | -8,647 |
| 1967 | 23,911 | 9,734 | 21,992 | -9,008 |
| 1966 | 23,326 | 7,248 | 23,228 | -9,254 |
| 1965 | 22,755 | 2,239 | 24,349 | -9,301 |
| 1964 | 22,116 | 2,198 | 25,065 | -9,193 |
| 1963 | 21,585 | 2,220 | 25,507 | -9,067 |
| 1962 | 21,132 | 2,172 | 25,763 | -8,982 |
| 1961 | 20,581 | 2,100 | 25,518 | -8,200 |
| 1960 | 19,981 | 1,989 | 24,766 | -5,671 |
Data sources: World Bank | Health (1960–2025, retrieved 2026-07-08).
GeoRank.org/population/lesotho/trinidad-and-tobago | CC BY
Over the last 10 years, 84.6% of the population change in Lesotho is from natural causes (a gain of 315,964 people) and 15.4% is from migration (a loss of 57,687 people). In Trinidad and Tobago 61.7% is from natural causes (a gain of 49,785 people) and 38.3% is from migration (a gain of 30,918 people).
As of 2024, 15,039 residents or 0.6% of the population were not native-born in Lesotho, compared to 113,478 people or 7.5% in Trinidad and Tobago.
Biggest cities by population
Compare countries by 7 more topics
Population differences between Lesotho and Trinidad and Tobago
|
Lesotho
|
Trinidad
|
|
|---|---|---|
| Life expectancy | 58.6 years | 73.9 years |
| Average age | 26 years | 38.5 years |
| Median age | 22.9 years | 38.6 years |
| Male:Female ratio | 48.8:51.2 | 49.4:50.6 |
| Fertility rate | 2.66 births per woman | 1.54 births per woman |
| Population density | 203.8 ppl/mi² | 692 ppl/mi² |
Population map with other countries
Data sources: World Bank | Health (1960–2025, retrieved 2026-07-08); United Nations | World Population Prospects (1960–2026, retrieved 2026-07-08); U.S. Census Bureau (1960–2025, retrieved 2026-07-08); Central Intelligence Agency (CIA) (2000–2019, retrieved 2026-07-08).
GeoRank.org/population/lesotho/trinidad-and-tobago | CC BY
Help us show the world through your eyes
Share a photo of your city and help others discover what it looks like to live there. Your contribution makes our data come alive.
Data sources:
- World Bank | Health (1960–2025, retrieved 2026-07-08)
- United Nations | World Population Prospects (1960–2100, retrieved 2026-07-08)
- U.S. Census Bureau (1960–2025, retrieved 2026-07-08)
- Central Intelligence Agency (CIA) (2000–2019, retrieved 2026-07-08)
- Wikidata (2026, retrieved 2026-07-08)
Creative Commons Attribution (CC BY) — you’re free to copy, share, remix, adapt, and use even commercially as long as you give appropriate credit and clearly indicate if you made changes. Other sources may be subject to different license terms.