The latest officially reported population of Italy was 58,915,656 in 2025 vs 136,488 people in Kiribati in 2025. In 2026, based on the adjusted UN estimation, the current Italy's population is 58,708,169 people compared to 139,471 in Kiribati.
Population statistics:
- Italy's population is 421 times bigger than Kiribati's.
- Italy is ranked the 26th most populous country in the world, while Kiribati is the 180th.
- The countries together account for 0.71% of the world: 0.71% for Italy vs 0.002% for Kiribati.
- For the last 10 years, Italy has had an average growth rate of -0.21% per year vs +1.54% in Kiribati.
- Since 2006, the population of Italy has increased from 58.4M people to 58.7M (0.53% growth), while Kiribati has grown from 100K to 139K (39.4% growth).
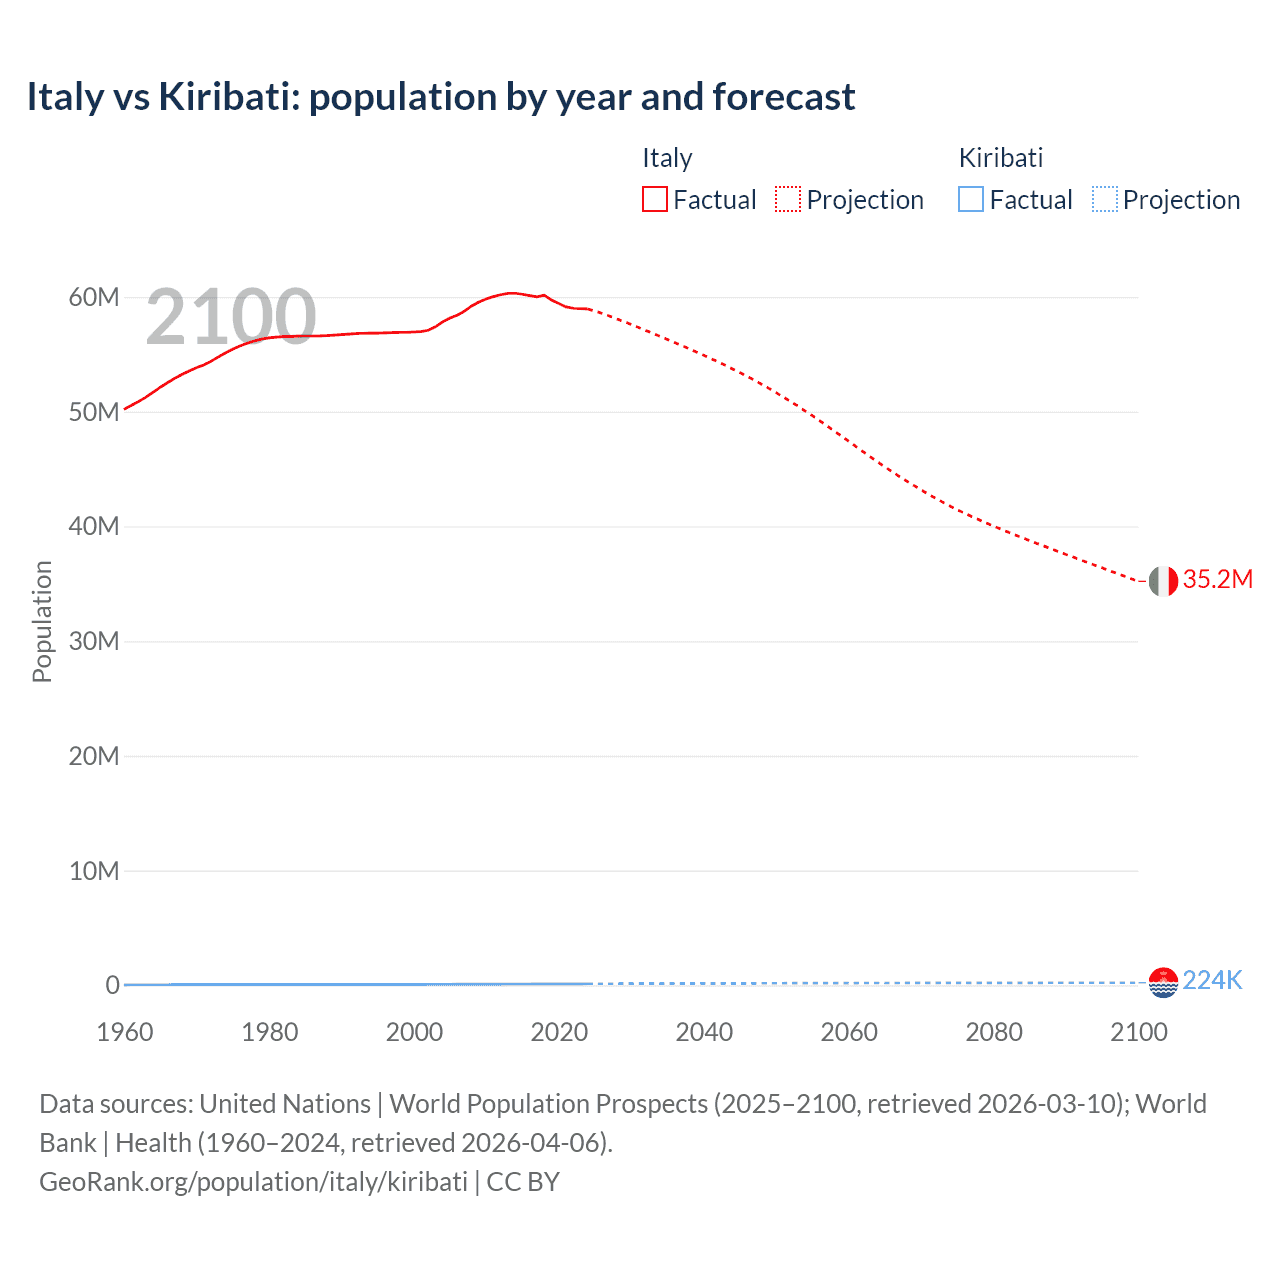
Italy vs Kiribati: population by year and forecast
| Year | Population | |
|---|---|---|
 Italy
Italy
|
 Kiribati
|
|
| 2100 | 35,295,729 | 224,260 |
| 2099 | 35,533,045 | 224,254 |
| 2098 | 35,764,971 | 224,229 |
| 2097 | 36,003,567 | 224,174 |
| 2096 | 36,240,310 | 224,085 |
| 2095 | 36,477,183 | 223,967 |
| 2094 | 36,710,370 | 223,780 |
| 2093 | 36,941,728 | 223,566 |
| 2092 | 37,181,889 | 223,301 |
| 2091 | 37,416,123 | 222,947 |
| 2090 | 37,654,289 | 222,560 |
| 2089 | 37,896,069 | 222,192 |
| 2088 | 38,134,560 | 221,771 |
| 2087 | 38,375,540 | 221,299 |
| 2086 | 38,612,968 | 220,824 |
| 2085 | 38,857,421 | 220,313 |
| 2084 | 39,105,783 | 219,763 |
| 2083 | 39,352,795 | 219,182 |
| 2082 | 39,608,119 | 218,584 |
| 2081 | 39,866,527 | 217,980 |
| 2080 | 40,130,426 | 217,336 |
| 2079 | 40,403,049 | 216,656 |
| 2078 | 40,680,460 | 215,964 |
| 2077 | 40,962,463 | 215,293 |
| 2076 | 41,254,005 | 214,551 |
| 2075 | 41,558,635 | 213,772 |
| 2074 | 41,883,296 | 212,966 |
| 2073 | 42,216,283 | 212,150 |
| 2072 | 42,564,739 | 211,321 |
| 2071 | 42,921,274 | 210,433 |
| 2070 | 43,295,245 | 209,514 |
| 2069 | 43,679,714 | 208,590 |
| 2068 | 44,073,736 | 207,578 |
| 2067 | 44,471,480 | 206,500 |
| 2066 | 44,883,154 | 205,437 |
| 2065 | 45,309,461 | 204,305 |
| 2064 | 45,741,985 | 203,169 |
| 2063 | 46,180,658 | 201,971 |
| 2062 | 46,633,125 | 200,805 |
| 2061 | 47,088,290 | 199,579 |
| 2060 | 47,542,648 | 198,300 |
| 2059 | 47,998,659 | 196,920 |
| 2058 | 48,452,892 | 195,512 |
| 2057 | 48,899,246 | 194,057 |
| 2056 | 49,344,799 | 192,565 |
| 2055 | 49,776,680 | 191,068 |
| 2054 | 50,197,999 | 189,537 |
| 2053 | 50,613,632 | 188,014 |
| 2052 | 51,012,772 | 186,393 |
| 2051 | 51,404,003 | 184,788 |
| 2050 | 51,791,523 | 183,093 |
| 2049 | 52,164,254 | 181,341 |
| 2048 | 52,522,170 | 179,541 |
| 2047 | 52,876,346 | 177,797 |
| 2046 | 53,212,697 | 175,976 |
| 2045 | 53,541,344 | 174,160 |
| 2044 | 53,856,790 | 172,343 |
| 2043 | 54,176,580 | 170,465 |
| 2042 | 54,477,632 | 168,618 |
| 2041 | 54,765,213 | 166,788 |
| 2040 | 55,052,803 | 164,991 |
| 2039 | 55,342,225 | 163,140 |
| 2038 | 55,619,470 | 161,276 |
| 2037 | 55,895,913 | 159,395 |
| 2036 | 56,164,408 | 157,498 |
| 2035 | 56,435,468 | 155,626 |
| 2034 | 56,703,168 | 153,791 |
| 2033 | 56,963,528 | 151,928 |
| 2032 | 57,220,334 | 150,051 |
| 2031 | 57,487,786 | 148,135 |
| 2030 | 57,749,232 | 146,228 |
| 2029 | 57,994,812 | 144,310 |
| 2028 | 58,236,078 | 142,397 |
| 2027 | 58,477,957 | 140,429 |
| 2026 | 58,708,169 | 138,461 |
| 2025 | 58,915,656 | 136,488 |
| 2024 | 58,952,704 | 134,518 |
| 2023 | 58,984,216 | 132,530 |
| 2022 | 59,013,667 | 130,469 |
| 2021 | 59,133,173 | 128,377 |
| 2020 | 59,438,851 | 126,099 |
| 2019 | 59,729,081 | 123,921 |
| 2018 | 59,877,221 | 122,084 |
| 2017 | 60,002,252 | 120,275 |
| 2016 | 60,115,223 | 118,478 |
| 2015 | 60,229,605 | 116,815 |
| 2014 | 60,320,707 | 115,326 |
| 2013 | 60,311,613 | 113,838 |
| 2012 | 60,191,247 | 112,284 |
| 2011 | 60,026,841 | 110,647 |
| 2010 | 59,819,407 | 108,704 |
| 2009 | 59,555,454 | 106,467 |
| 2008 | 59,211,181 | 104,222 |
| 2007 | 58,756,247 | 102,068 |
| 2006 | 58,399,861 | 100,017 |
| 2005 | 58,166,682 | 98,035 |
| 2004 | 57,828,179 | 96,085 |
| 2003 | 57,399,184 | 94,175 |
| 2002 | 57,089,824 | 92,264 |
| 2001 | 56,976,981 | 90,335 |
| 2000 | 56,942,108 | 88,613 |
| 1999 | 56,916,317 | 87,126 |
| 1998 | 56,906,744 | 85,657 |
| 1997 | 56,890,372 | 84,147 |
| 1996 | 56,860,281 | 82,623 |
| 1995 | 56,844,303 | 81,234 |
| 1994 | 56,843,400 | 80,021 |
| 1993 | 56,831,821 | 78,841 |
| 1992 | 56,797,087 | 77,641 |
| 1991 | 56,758,521 | 76,367 |
| 1990 | 56,719,240 | 74,855 |
| 1989 | 56,671,781 | 73,147 |
| 1988 | 56,629,288 | 71,427 |
| 1987 | 56,601,931 | 69,733 |
| 1986 | 56,596,155 | 68,059 |
| 1985 | 56,593,071 | 66,496 |
| 1984 | 56,576,718 | 65,228 |
| 1983 | 56,564,074 | 64,169 |
| 1982 | 56,543,548 | 63,134 |
| 1981 | 56,501,675 | 62,121 |
| 1980 | 56,433,883 | 61,148 |
| 1979 | 56,317,749 | 60,172 |
| 1978 | 56,155,143 | 59,864 |
| 1977 | 55,955,411 | 60,267 |
| 1976 | 55,718,260 | 60,661 |
| 1975 | 55,441,001 | 60,987 |
| 1974 | 55,110,868 | 61,219 |
| 1973 | 54,751,406 | 60,824 |
| 1972 | 54,381,345 | 59,778 |
| 1971 | 54,073,490 | 58,652 |
| 1970 | 53,821,850 | 57,510 |
| 1969 | 53,537,950 | 56,360 |
| 1968 | 53,235,750 | 55,529 |
| 1967 | 52,900,500 | 54,996 |
| 1966 | 52,519,000 | 54,425 |
| 1965 | 52,112,350 | 53,439 |
| 1964 | 51,675,350 | 52,088 |
| 1963 | 51,252,000 | 50,791 |
| 1962 | 50,879,450 | 49,538 |
| 1961 | 50,536,350 | 48,323 |
| 1960 | 50,199,700 | 47,157 |
Data sources: United Nations | World Population Prospects (2026–2100, retrieved 2026-07-08); World Bank | Health (1960–2025, retrieved 2026-07-08).
GeoRank.org/population/italy/kiribati | CC BY 
From 2006 to 2016, the population of Italy increased by 1,715,362 people (a 2.94% growth), while Kiribati gained 18,461 people (a 18.5% growth).
For the next 10 years, from 2016 to 2026, Italy lost 1,407,054 people (a 2.34% decline), while Kiribati's population increased by 20,993 people (a 17.7% growth).
Italy was ranked 23rd most populous country in 2006 and is 26th in 2026. Kiribati was ranked 183rd in 2006 and ranked 180th now.
The UN's World Population Prospects forecasts that in 24 years (in 2050) Italy's population will shrink by 11.8% to 51,791,523 people with a rank change from 26th to 40th. The population of Kiribati will increase by 31.3% to 183,093 people and rank change from 180th to 178th.
Kiribati is projected to reach its peak in 2100 at 224K people, while Italy's population already peaked in 2014 at 60.3M people and is projected to decrease to 35.3M people by 2100.
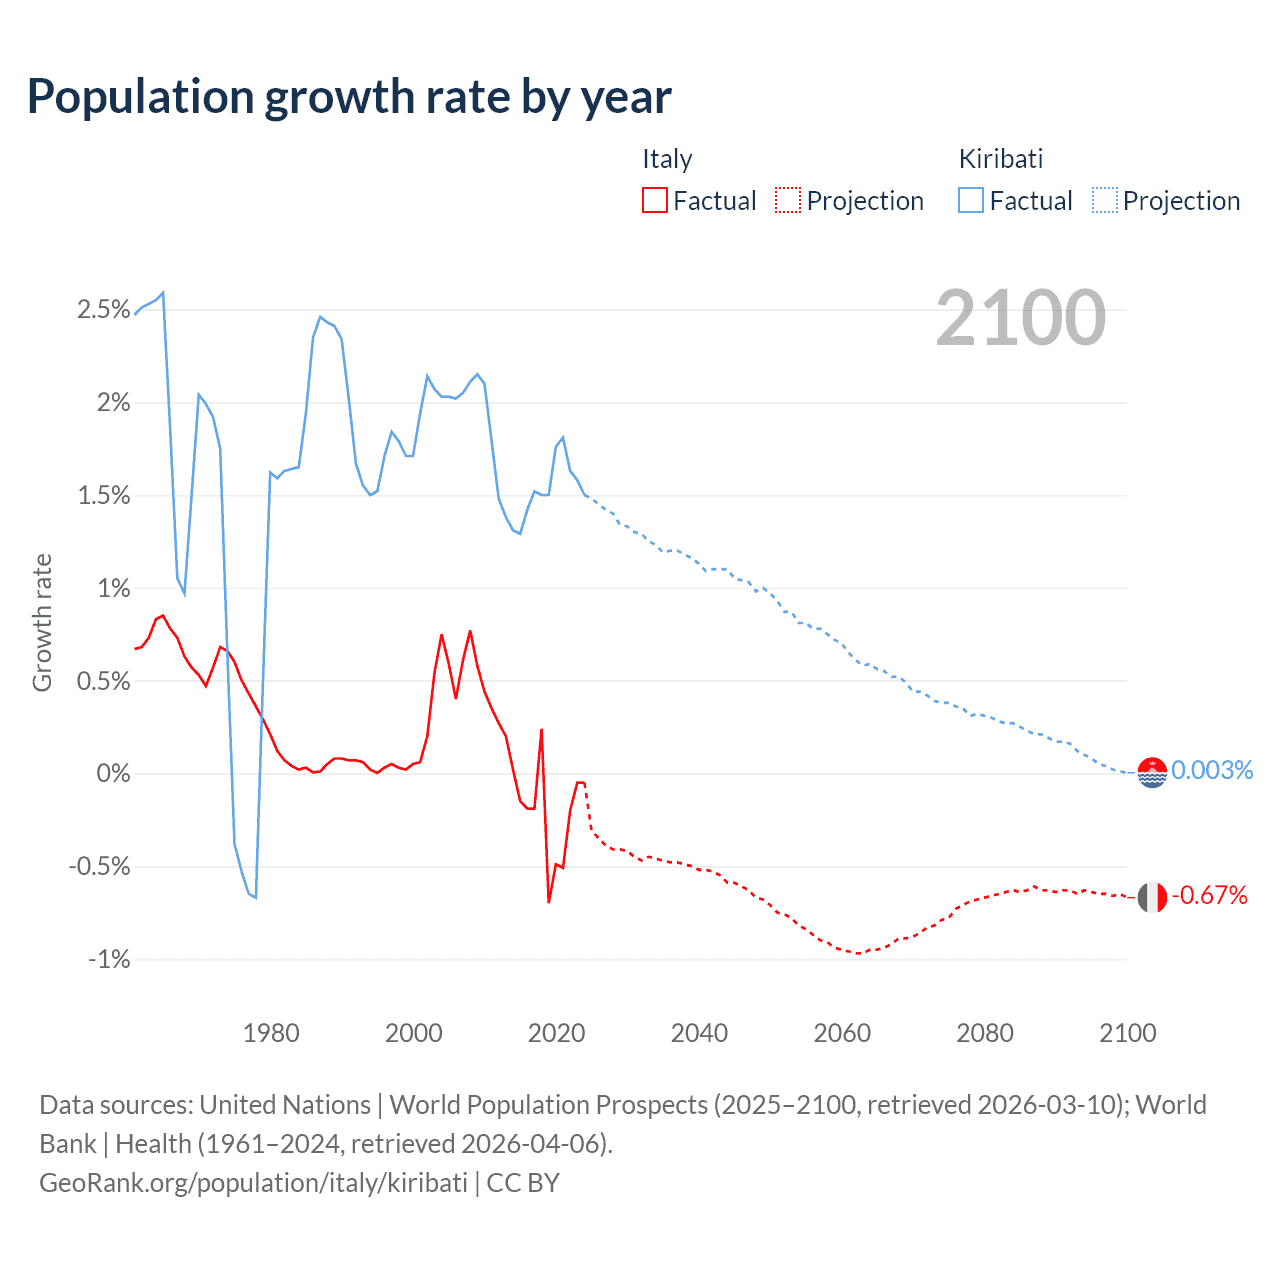
Population growth rate by year
| Year | Growth rate | |
|---|---|---|
|
Italy
|
Kiribati
|
|
| 2100 | -0.67% | 0.003% |
| 2099 | -0.65% | 0.01% |
| 2098 | -0.66% | 0.02% |
| 2097 | -0.65% | 0.04% |
| 2096 | -0.65% | 0.05% |
| 2095 | -0.64% | 0.08% |
| 2094 | -0.63% | 0.1% |
| 2093 | -0.65% | 0.12% |
| 2092 | -0.63% | 0.16% |
| 2091 | -0.63% | 0.17% |
| 2090 | -0.64% | 0.17% |
| 2089 | -0.63% | 0.19% |
| 2088 | -0.63% | 0.21% |
| 2087 | -0.61% | 0.21% |
| 2086 | -0.63% | 0.23% |
| 2085 | -0.64% | 0.25% |
| 2084 | -0.63% | 0.27% |
| 2083 | -0.64% | 0.27% |
| 2082 | -0.65% | 0.28% |
| 2081 | -0.66% | 0.3% |
| 2080 | -0.67% | 0.31% |
| 2079 | -0.68% | 0.32% |
| 2078 | -0.69% | 0.31% |
| 2077 | -0.71% | 0.35% |
| 2076 | -0.73% | 0.36% |
| 2075 | -0.78% | 0.38% |
| 2074 | -0.79% | 0.38% |
| 2073 | -0.82% | 0.39% |
| 2072 | -0.83% | 0.42% |
| 2071 | -0.86% | 0.44% |
| 2070 | -0.88% | 0.44% |
| 2069 | -0.89% | 0.49% |
| 2068 | -0.89% | 0.52% |
| 2067 | -0.92% | 0.52% |
| 2066 | -0.94% | 0.55% |
| 2065 | -0.95% | 0.56% |
| 2064 | -0.95% | 0.59% |
| 2063 | -0.97% | 0.58% |
| 2062 | -0.97% | 0.61% |
| 2061 | -0.96% | 0.65% |
| 2060 | -0.95% | 0.7% |
| 2059 | -0.94% | 0.72% |
| 2058 | -0.91% | 0.75% |
| 2057 | -0.9% | 0.78% |
| 2056 | -0.87% | 0.78% |
| 2055 | -0.84% | 0.81% |
| 2054 | -0.82% | 0.81% |
| 2053 | -0.78% | 0.87% |
| 2052 | -0.76% | 0.87% |
| 2051 | -0.75% | 0.93% |
| 2050 | -0.71% | 0.97% |
| 2049 | -0.68% | 1% |
| 2048 | -0.67% | 0.98% |
| 2047 | -0.63% | 1.03% |
| 2046 | -0.61% | 1.04% |
| 2045 | -0.59% | 1.05% |
| 2044 | -0.59% | 1.1% |
| 2043 | -0.55% | 1.1% |
| 2042 | -0.53% | 1.1% |
| 2041 | -0.52% | 1.09% |
| 2040 | -0.52% | 1.13% |
| 2039 | -0.5% | 1.16% |
| 2038 | -0.49% | 1.18% |
| 2037 | -0.48% | 1.2% |
| 2036 | -0.48% | 1.2% |
| 2035 | -0.47% | 1.19% |
| 2034 | -0.46% | 1.23% |
| 2033 | -0.45% | 1.25% |
| 2032 | -0.47% | 1.29% |
| 2031 | -0.45% | 1.3% |
| 2030 | -0.42% | 1.33% |
| 2029 | -0.41% | 1.34% |
| 2028 | -0.41% | 1.4% |
| 2027 | -0.39% | 1.42% |
| 2026 | -0.35% | 1.45% |
| 2025 | -0.06% | 1.46% |
| 2024 | -0.05% | 1.5% |
| 2023 | -0.05% | 1.58% |
| 2022 | -0.2% | 1.63% |
| 2021 | -0.51% | 1.81% |
| 2020 | -0.49% | 1.76% |
| 2019 | -0.25% | 1.5% |
| 2018 | -0.21% | 1.5% |
| 2017 | -0.19% | 1.52% |
| 2016 | -0.19% | 1.42% |
| 2015 | -0.15% | 1.29% |
| 2014 | 0.02% | 1.31% |
| 2013 | 0.2% | 1.38% |
| 2012 | 0.27% | 1.48% |
| 2011 | 0.35% | 1.79% |
| 2010 | 0.44% | 2.1% |
| 2009 | 0.58% | 2.15% |
| 2008 | 0.77% | 2.11% |
| 2007 | 0.61% | 2.05% |
| 2006 | 0.4% | 2.02% |
| 2005 | 0.59% | 2.03% |
| 2004 | 0.75% | 2.03% |
| 2003 | 0.54% | 2.07% |
| 2002 | 0.2% | 2.14% |
| 2001 | 0.06% | 1.94% |
| 2000 | 0.05% | 1.71% |
| 1999 | 0.02% | 1.71% |
| 1998 | 0.03% | 1.79% |
| 1997 | 0.05% | 1.84% |
| 1996 | 0.03% | 1.71% |
| 1995 | 0.002% | 1.52% |
| 1994 | 0.02% | 1.5% |
| 1993 | 0.06% | 1.55% |
| 1992 | 0.07% | 1.67% |
| 1991 | 0.07% | 2.02% |
| 1990 | 0.08% | 2.34% |
| 1989 | 0.08% | 2.41% |
| 1988 | 0.05% | 2.43% |
| 1987 | 0.01% | 2.46% |
| 1986 | 0.005% | 2.35% |
| 1985 | 0.03% | 1.94% |
| 1984 | 0.02% | 1.65% |
| 1983 | 0.04% | 1.64% |
| 1982 | 0.07% | 1.63% |
| 1981 | 0.12% | 1.59% |
| 1980 | 0.21% | 1.62% |
| 1979 | 0.29% | 0.51% |
| 1978 | 0.36% | -0.67% |
| 1977 | 0.43% | -0.65% |
| 1976 | 0.5% | -0.53% |
| 1975 | 0.6% | -0.38% |
| 1974 | 0.66% | 0.65% |
| 1973 | 0.68% | 1.75% |
| 1972 | 0.57% | 1.92% |
| 1971 | 0.47% | 1.99% |
| 1970 | 0.53% | 2.04% |
| 1969 | 0.57% | 1.5% |
| 1968 | 0.63% | 0.97% |
| 1967 | 0.73% | 1.05% |
| 1966 | 0.78% | 1.85% |
| 1965 | 0.85% | 2.59% |
| 1964 | 0.83% | 2.55% |
| 1963 | 0.73% | 2.53% |
| 1962 | 0.68% | 2.51% |
| 1961 | 0.67% | 2.47% |
Data sources: United Nations | World Population Prospects (2026–2100, retrieved 2026-07-08); World Bank | Health (1961–2025, retrieved 2026-07-08).
GeoRank.org/population/italy/kiribati | CC BY
In 2025, the population of Italy declined by 0.06%, while Kiribati's population grew by 1.46%.
Live population counters
|
Italy
|
Kiribati
|
|
|---|---|---|
| Current population |
58708169
|
139471
|
| Population rank | 26/197 | 180/197 |
| Percent of world population | 0.71% | 0.002% |
| One net population change |
14.2 minutes
|
4.46 hours
|
| One birth every |
1.42 minutes
|
2.57 hours
|
| One death every |
48.6 seconds
|
9.23 hours
|
| Daily growth/decline | -102 | +5 |
| Annual growth/decline | -37,048 | +1,970 |
| Annual growth/decline rate | -0.06% | +1.46% |
| Population growth rate rank | 162/197 | 72/197 |
| One migration net change every |
6.99 minutes
|
19 hours
|
| Annual migration change | +75,448 | -462 |
| Net migration rank | 19/196 | 88/196 |
| Foreign-born residents | 6,553,671 | 3,302 |
| Foreign-born residents rank | 12/195 | 190/195 |
| Foreign-born share of population | 11% | 2.5% |
| Foreign-born share rank | 59/195 | 128/195 |
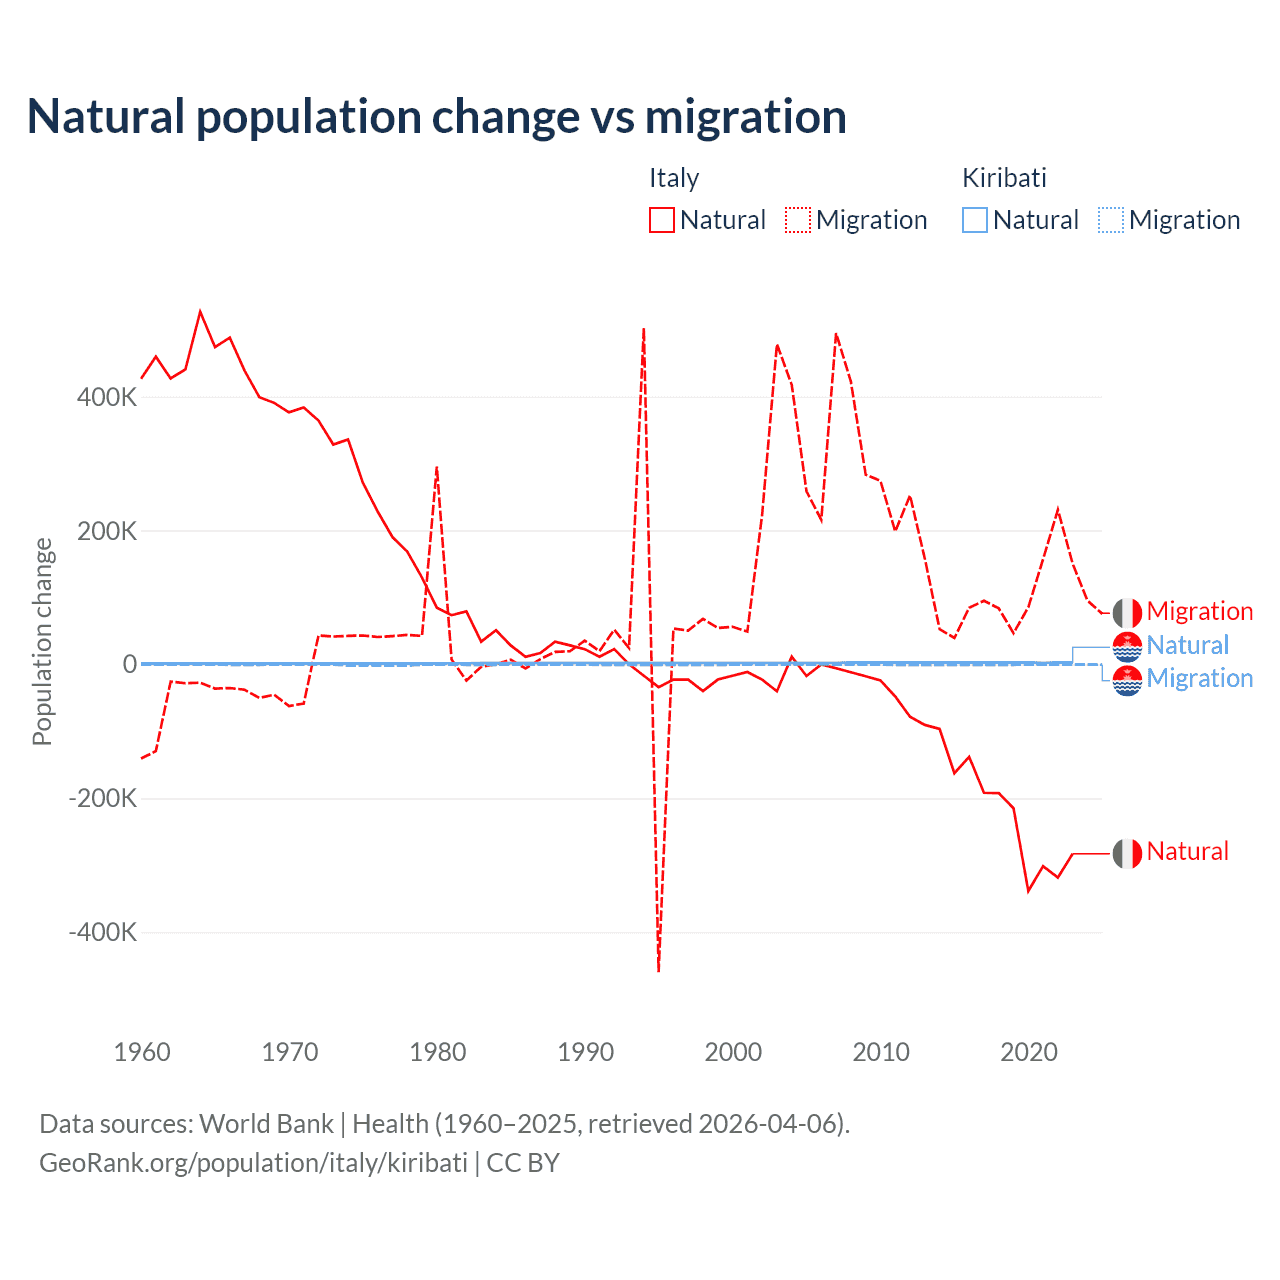
Natural population change vs migration
| Year | Population change | |||
|---|---|---|---|---|
|
Italy
|
Kiribati
|
|||
| Natural | Migration | Natural | Migration | |
| 2025 | - | 75,448 | - | -462 |
| 2024 | -277,077 | 95,246 | 2,455 | -471 |
| 2023 | -294,922 | 150,189 | 2,487 | -485 |
| 2022 | -318,674 | 231,228 | 2,522 | -395 |
| 2021 | -301,579 | 157,327 | 2,408 | -348 |
| 2020 | -338,801 | 85,281 | 2,497 | 0 |
| 2019 | -215,025 | 46,634 | 2,560 | -705 |
| 2018 | -197,595 | 83,686 | 2,561 | -741 |
| 2017 | -192,007 | 95,147 | 2,549 | -750 |
| 2016 | -138,265 | 84,568 | 2,546 | -756 |
| 2015 | -162,620 | 39,389 | 2,555 | -1,022 |
| 2014 | -96,513 | 52,679 | 2,577 | -1,128 |
| 2013 | -90,468 | 158,090 | 2,629 | -1,101 |
| 2012 | -78,248 | 252,524 | 2,678 | -1,093 |
| 2011 | -48,021 | 198,544 | 2,709 | -1,019 |
| 2010 | -23,928 | 274,387 | 2,644 | -456 |
| 2009 | -17,866 | 283,676 | 2,573 | -289 |
| 2008 | -11,842 | 422,534 | 2,493 | -289 |
| 2007 | -5,876 | 495,092 | 2,393 | -290 |
| 2006 | 0 | 215,995 | 2,285 | -290 |
| 2005 | -17,450 | 258,702 | 2,188 | -226 |
| 2004 | 11,566 | 417,970 | 2,118 | -181 |
| 2003 | -40,179 | 478,578 | 2,045 | -157 |
| 2002 | -22,836 | 223,861 | 2,074 | -137 |
| 2001 | -11,396 | 48,903 | 2,121 | -201 |
| 2000 | -17,082 | 56,065 | 2,153 | -629 |
| 1999 | -22,766 | 54,405 | 2,186 | -733 |
| 1998 | -39,835 | 67,985 | 2,210 | -716 |
| 1997 | -22,756 | 50,539 | 2,220 | -693 |
| 1996 | -22,744 | 53,450 | 2,217 | -701 |
| 1995 | -34,107 | -460,287 | 2,183 | -928 |
| 1994 | -17,053 | 502,750 | 2,168 | -996 |
| 1993 | 0 | 24,321 | 2,161 | -975 |
| 1992 | 22,718 | 51,747 | 2,173 | -951 |
| 1991 | 11,352 | 19,721 | 2,176 | -844 |
| 1990 | 22,688 | 35,317 | 2,127 | -441 |
| 1989 | 28,336 | 19,540 | 2,073 | -338 |
| 1988 | 33,977 | 18,553 | 2,022 | -321 |
| 1987 | 16,980 | 7,825 | 1,982 | -298 |
| 1986 | 11,319 | -6,206 | 1,933 | -273 |
| 1985 | 28,297 | 6,911 | 1,881 | -419 |
| 1984 | 50,919 | 203 | 1,813 | -730 |
| 1983 | 33,939 | -3,733 | 1,748 | -702 |
| 1982 | 79,161 | -24,223 | 1,697 | -674 |
| 1981 | 73,452 | 7,182 | 1,635 | -645 |
| 1980 | 84,650 | 295,642 | 1,571 | -610 |
| 1979 | 129,531 | 42,637 | 1,509 | -516 |
| 1978 | 168,465 | 43,932 | 1,480 | -1,858 |
| 1977 | 190,248 | 42,246 | 1,426 | -1,854 |
| 1976 | 228,445 | 40,885 | 1,425 | -1,795 |
| 1975 | 271,660 | 43,051 | 1,423 | -1,706 |
| 1974 | 336,176 | 42,487 | 1,430 | -1,605 |
| 1973 | 328,508 | 41,631 | 1,409 | -440 |
| 1972 | 364,355 | 43,182 | 1,406 | -290 |
| 1971 | 383,922 | -58,627 | 1,406 | -265 |
| 1970 | 376,753 | -62,216 | 1,388 | -233 |
| 1969 | 390,827 | -45,346 | 1,367 | -222 |
| 1968 | 399,268 | -50,149 | 1,393 | -876 |
| 1967 | 439,074 | -37,992 | 1,417 | -873 |
| 1966 | 488,427 | -35,352 | 1,437 | -840 |
| 1965 | 474,222 | -36,267 | 1,376 | 0 |
| 1964 | 527,089 | -27,368 | 1,318 | 0 |
| 1963 | 440,767 | -28,198 | 1,273 | 0 |
| 1962 | 427,387 | -25,840 | 1,233 | 0 |
| 1961 | 459,880 | -129,761 | 1,199 | 0 |
| 1960 | 426,697 | -140,765 | 1,141 | 0 |
Data sources: World Bank | Health (1960–2025, retrieved 2026-07-08).
GeoRank.org/population/italy/kiribati | CC BY
Over the last 10 years, 69.5% of the population change in Italy is from natural causes (a loss of 2,436,565 people) and 30.5% is from migration (a gain of 1,068,695 people). In Kiribati 81.6% is from natural causes (a gain of 25,140 people) and 18.4% is from migration (a loss of 5,673 people).
As of 2024, 6,553,671 residents or 11% of the population were not native-born in Italy, compared to 3,302 people or 2.5% in Kiribati.
Biggest cities by population
Compare countries by 7 more topics
Population differences between Italy and Kiribati
|
Italy
|
Kiribati
|
|
|---|---|---|
| Life expectancy | 84.2 years | 66.9 years |
| Average age | 46.7 years | 27.2 years |
| Median age | 49.2 years | 23.9 years |
| Male:Female ratio | 48.9:51.1 | 48.6:51.4 |
| Fertility rate | 1.18 births per woman | 3.12 births per woman |
| Population density | 514 ppl/mi² | 443 ppl/mi² |
Population map with other countries
Data sources: World Bank | Health (1960–2025, retrieved 2026-07-08); United Nations | World Population Prospects (1960–2026, retrieved 2026-07-08); U.S. Census Bureau (1960–2025, retrieved 2026-07-08); Central Intelligence Agency (CIA) (2000–2019, retrieved 2026-07-08).
GeoRank.org/population/italy/kiribati | CC BY
Help us show the world through your eyes
Share a photo of your city and help others discover what it looks like to live there. Your contribution makes our data come alive.
Data sources:
- World Bank | Health (1960–2025, retrieved 2026-07-08)
- United Nations | World Population Prospects (1960–2100, retrieved 2026-07-08)
- U.S. Census Bureau (1960–2025, retrieved 2026-07-08)
- Central Intelligence Agency (CIA) (2000–2019, retrieved 2026-07-08)
- Wikidata (2026, retrieved 2026-07-08)
Creative Commons Attribution (CC BY) — you’re free to copy, share, remix, adapt, and use even commercially as long as you give appropriate credit and clearly indicate if you made changes. Other sources may be subject to different license terms.