The latest officially reported population of the Dominican Republic was 11,520,487 in 2025 vs 15,099,727 people in Guinea in 2025. In 2026, based on the adjusted UN estimation, the current Dominican Republic's population is 11,656,588 people compared to 15,624,314 in Guinea.
Population statistics:
- Guinea's population is 1.34 times bigger than the Dominican Republic's.
- The Dominican Republic is ranked the 85th most populous country in the world, while Guinea is the 75th.
- The countries together account for 0.33% of the world: 0.14% for the Dominican Republic vs 0.19% for Guinea.
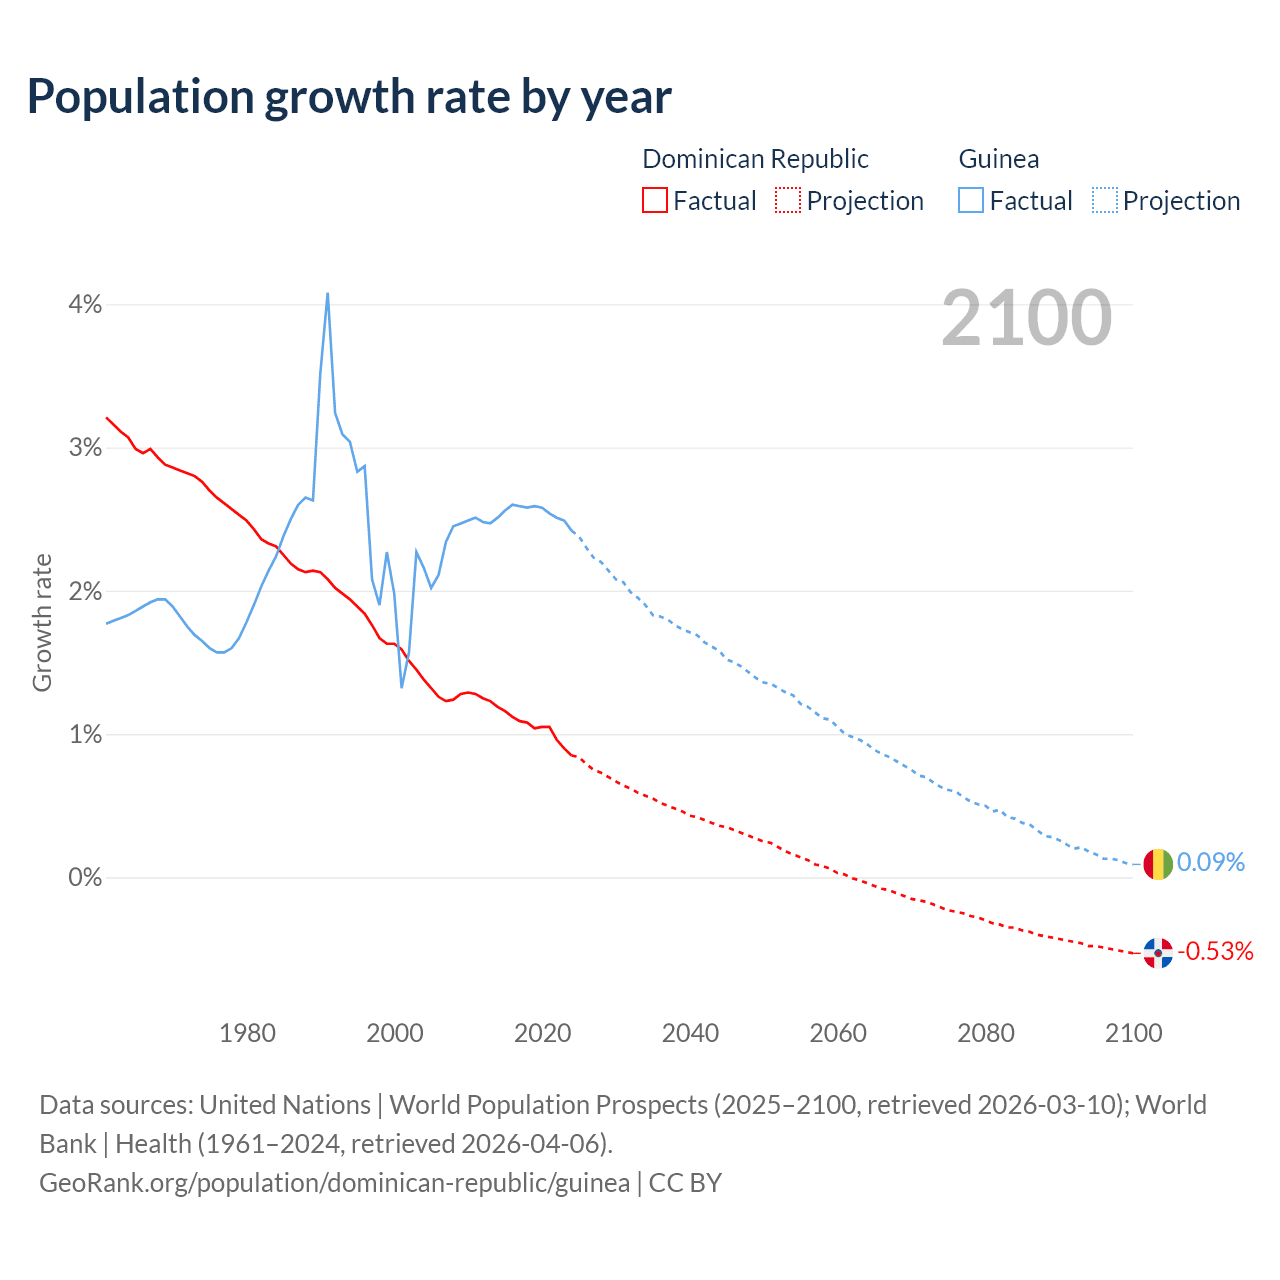
- For the last 10 years, the Dominican Republic has had an average growth rate of +1.01% per year vs +2.53% in Guinea.
- Since 2006, the population of the Dominican Republic has increased from 9.34M people to 11.7M (24.8% growth), while Guinea has grown from 9.44M to 15.6M (65.5% growth).
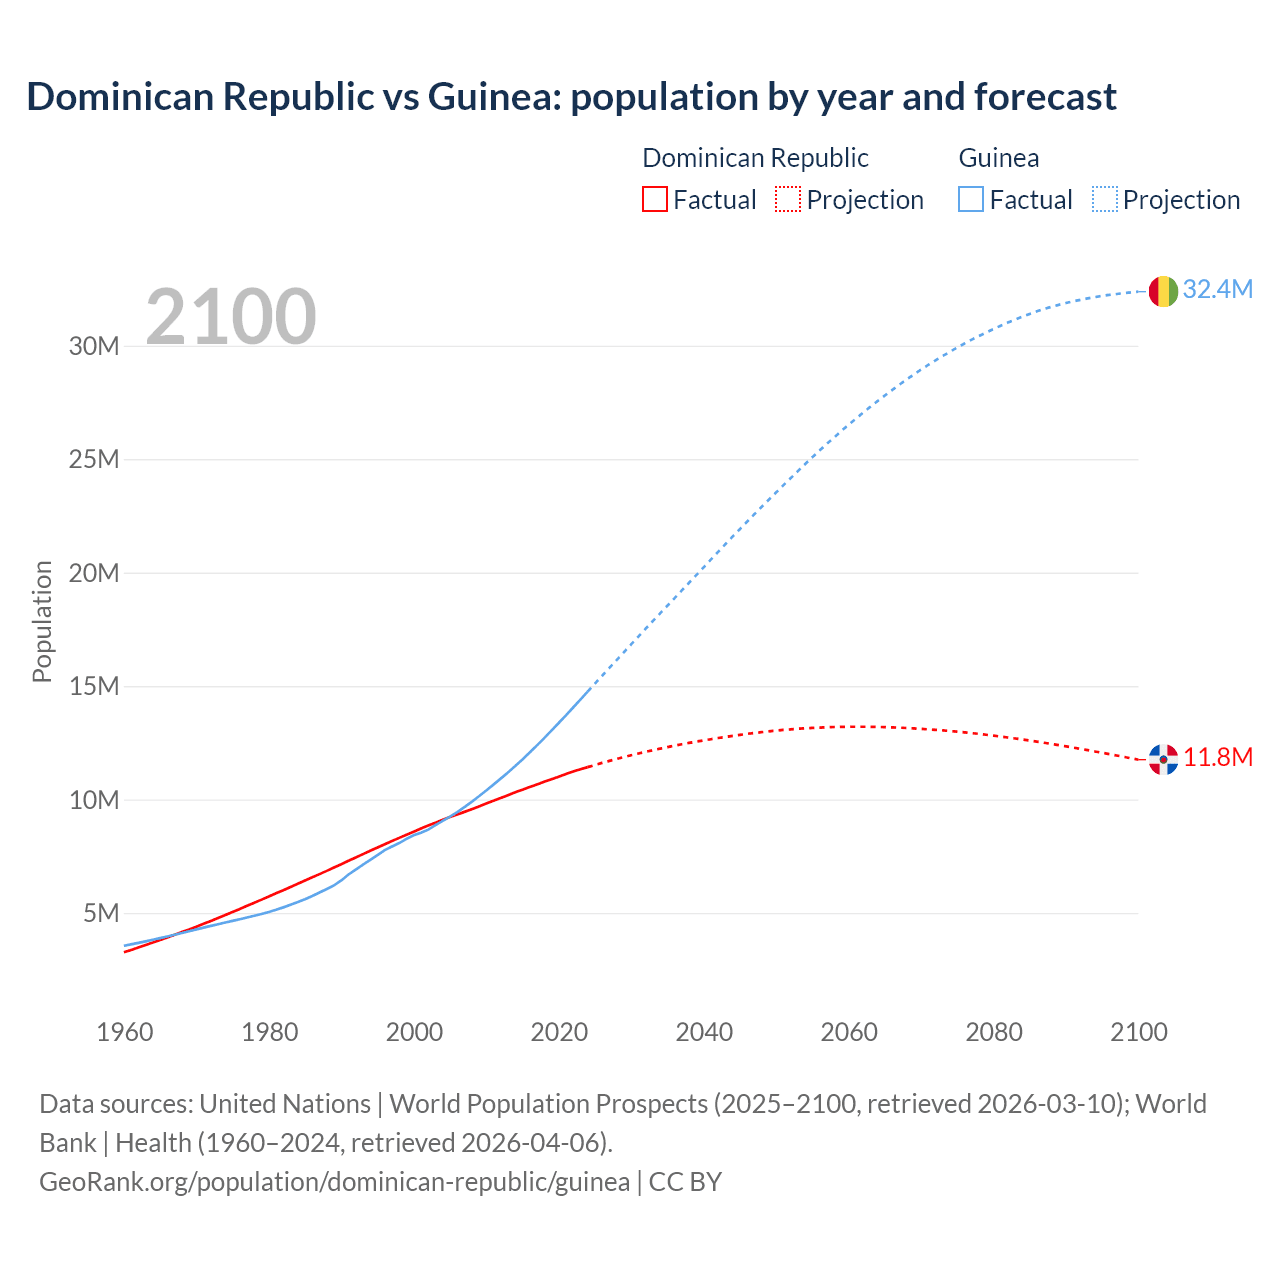
Dominican Republic vs Guinea: population by year and forecast
| Year | Population | |
|---|---|---|
 Dominican Republic
|
 Guinea
|
|
| 2100 | 11,752,784 | 32,364,089 |
| 2099 | 11,815,252 | 32,335,737 |
| 2098 | 11,877,117 | 32,301,888 |
| 2097 | 11,937,719 | 32,264,245 |
| 2096 | 11,997,841 | 32,223,409 |
| 2095 | 12,057,342 | 32,180,906 |
| 2094 | 12,115,914 | 32,128,461 |
| 2093 | 12,173,845 | 32,070,233 |
| 2092 | 12,230,436 | 32,004,039 |
| 2091 | 12,286,064 | 31,938,993 |
| 2090 | 12,340,658 | 31,865,431 |
| 2089 | 12,394,314 | 31,784,278 |
| 2088 | 12,446,122 | 31,695,025 |
| 2087 | 12,497,009 | 31,604,442 |
| 2086 | 12,546,890 | 31,501,968 |
| 2085 | 12,595,176 | 31,385,846 |
| 2084 | 12,641,964 | 31,266,394 |
| 2083 | 12,686,626 | 31,137,977 |
| 2082 | 12,730,579 | 31,006,787 |
| 2081 | 12,772,531 | 30,862,718 |
| 2080 | 12,813,012 | 30,721,315 |
| 2079 | 12,851,452 | 30,567,350 |
| 2078 | 12,887,954 | 30,411,381 |
| 2077 | 12,923,053 | 30,251,450 |
| 2076 | 12,955,793 | 30,082,310 |
| 2075 | 12,986,456 | 29,901,467 |
| 2074 | 13,015,960 | 29,719,623 |
| 2073 | 13,043,173 | 29,532,278 |
| 2072 | 13,068,464 | 29,339,197 |
| 2071 | 13,091,361 | 29,136,328 |
| 2070 | 13,112,865 | 28,929,558 |
| 2069 | 13,131,909 | 28,713,370 |
| 2068 | 13,149,031 | 28,491,765 |
| 2067 | 13,163,707 | 28,263,091 |
| 2066 | 13,176,149 | 28,028,228 |
| 2065 | 13,187,108 | 27,789,471 |
| 2064 | 13,195,655 | 27,544,497 |
| 2063 | 13,201,391 | 27,289,819 |
| 2062 | 13,204,648 | 27,030,698 |
| 2061 | 13,205,517 | 26,767,195 |
| 2060 | 13,203,471 | 26,502,170 |
| 2059 | 13,199,071 | 26,227,034 |
| 2058 | 13,190,969 | 25,942,870 |
| 2057 | 13,180,617 | 25,657,776 |
| 2056 | 13,168,370 | 25,365,788 |
| 2055 | 13,153,175 | 25,067,342 |
| 2054 | 13,135,187 | 24,767,401 |
| 2053 | 13,114,225 | 24,455,823 |
| 2052 | 13,090,209 | 24,145,399 |
| 2051 | 13,063,047 | 23,832,003 |
| 2050 | 13,032,286 | 23,515,546 |
| 2049 | 12,999,890 | 23,200,886 |
| 2048 | 12,964,676 | 22,883,237 |
| 2047 | 12,927,592 | 22,559,713 |
| 2046 | 12,887,813 | 22,232,988 |
| 2045 | 12,845,519 | 21,903,369 |
| 2044 | 12,800,765 | 21,575,120 |
| 2043 | 12,754,444 | 21,238,706 |
| 2042 | 12,705,845 | 20,901,770 |
| 2041 | 12,655,390 | 20,563,787 |
| 2040 | 12,602,701 | 20,221,476 |
| 2039 | 12,548,652 | 19,882,253 |
| 2038 | 12,491,254 | 19,544,803 |
| 2037 | 12,431,970 | 19,207,349 |
| 2036 | 12,370,131 | 18,867,323 |
| 2035 | 12,305,889 | 18,529,941 |
| 2034 | 12,239,008 | 18,196,482 |
| 2033 | 12,170,158 | 17,857,890 |
| 2032 | 12,098,734 | 17,516,126 |
| 2031 | 12,024,555 | 17,173,592 |
| 2030 | 11,947,536 | 16,827,321 |
| 2029 | 11,867,856 | 16,484,980 |
| 2028 | 11,785,130 | 16,139,132 |
| 2027 | 11,699,216 | 15,792,131 |
| 2026 | 11,611,567 | 15,447,070 |
| 2025 | 11,520,487 | 15,099,727 |
| 2024 | 11,427,557 | 14,754,785 |
| 2023 | 11,331,265 | 14,405,468 |
| 2022 | 11,230,734 | 14,055,137 |
| 2021 | 11,123,476 | 13,710,513 |
| 2020 | 11,008,300 | 13,371,183 |
| 2019 | 10,894,043 | 13,034,346 |
| 2018 | 10,782,053 | 12,704,774 |
| 2017 | 10,666,843 | 12,385,659 |
| 2016 | 10,551,430 | 12,073,030 |
| 2015 | 10,434,829 | 11,767,070 |
| 2014 | 10,315,528 | 11,472,924 |
| 2013 | 10,193,833 | 11,191,873 |
| 2012 | 10,070,411 | 10,921,581 |
| 2011 | 9,945,621 | 10,656,810 |
| 2010 | 9,820,175 | 10,396,086 |
| 2009 | 9,695,265 | 10,143,534 |
| 2008 | 9,573,130 | 9,898,870 |
| 2007 | 9,455,658 | 9,662,281 |
| 2006 | 9,341,183 | 9,441,171 |
| 2005 | 9,225,034 | 9,245,844 |
| 2004 | 9,104,892 | 9,062,726 |
| 2003 | 8,980,620 | 8,870,781 |
| 2002 | 8,852,235 | 8,674,066 |
| 2001 | 8,720,283 | 8,539,960 |
| 2000 | 8,584,190 | 8,428,832 |
| 1999 | 8,446,208 | 8,265,123 |
| 1998 | 8,310,362 | 8,081,990 |
| 1997 | 8,174,078 | 7,931,370 |
| 1996 | 8,032,894 | 7,770,035 |
| 1995 | 7,888,115 | 7,553,249 |
| 1994 | 7,741,694 | 7,345,107 |
| 1993 | 7,594,572 | 7,128,177 |
| 1992 | 7,447,474 | 6,914,366 |
| 1991 | 7,299,853 | 6,697,166 |
| 1990 | 7,151,166 | 6,434,374 |
| 1989 | 7,002,295 | 6,215,811 |
| 1988 | 6,855,734 | 6,056,574 |
| 1987 | 6,712,515 | 5,900,198 |
| 1986 | 6,571,208 | 5,750,668 |
| 1985 | 6,430,404 | 5,610,373 |
| 1984 | 6,289,040 | 5,480,096 |
| 1983 | 6,147,248 | 5,359,814 |
| 1982 | 6,007,114 | 5,247,672 |
| 1981 | 5,868,453 | 5,143,288 |
| 1980 | 5,729,037 | 5,047,419 |
| 1979 | 5,589,690 | 4,959,283 |
| 1978 | 5,451,882 | 4,877,854 |
| 1977 | 5,315,443 | 4,801,128 |
| 1976 | 5,180,404 | 4,727,022 |
| 1975 | 5,046,776 | 4,653,876 |
| 1974 | 4,914,197 | 4,580,510 |
| 1973 | 4,782,227 | 4,506,324 |
| 1972 | 4,651,883 | 4,431,292 |
| 1971 | 4,524,234 | 4,355,200 |
| 1970 | 4,399,290 | 4,277,535 |
| 1969 | 4,277,035 | 4,198,300 |
| 1968 | 4,157,189 | 4,118,550 |
| 1967 | 4,038,928 | 4,040,153 |
| 1966 | 3,921,847 | 3,964,155 |
| 1965 | 3,808,963 | 3,890,716 |
| 1964 | 3,698,559 | 3,819,722 |
| 1963 | 3,588,287 | 3,750,954 |
| 1962 | 3,479,936 | 3,684,273 |
| 1961 | 3,373,233 | 3,619,551 |
| 1960 | 3,268,336 | 3,556,749 |
Data sources: United Nations | World Population Prospects (2026–2100, retrieved 2026-07-08); World Bank | Health (1960–2025, retrieved 2026-07-08).
GeoRank.org/population/dominican-republic/guinea | CC BY 
From 2006 to 2016, the population of the Dominican Republic increased by 1,210,247 people (a 13% growth), while Guinea gained 2,631,859 people (a 27.9% growth).
For the next 10 years, from 2016 to 2026, the Dominican Republic gained 1,105,158 people (a 10.5% growth), while Guinea's population increased by 3,551,284 people (a 29.4% growth).
The Dominican Republic was ranked 85th most populous country in 2006 and is still 85th in 2026. Guinea was ranked 84th in 2006 and ranked 75th now.
The UN's World Population Prospects forecasts that in 24 years (in 2050) the Dominican Republic's population will grow by 11.8% to 13,032,286 people with a rank change from 85th to 90th. The population of Guinea will increase by 50.5% to 23,515,546 people and rank change from 75th to 70th.
The Dominican Republic is projected to reach its peak in 2061 at 13.2M people compared to the peak of 32.4M people in 2100 for Guinea.
Population growth rate by year
| Year | Growth rate | |
|---|---|---|
|
Dominican Republic
|
Guinea
|
|
| 2100 | -0.53% | 0.09% |
| 2099 | -0.52% | 0.1% |
| 2098 | -0.51% | 0.12% |
| 2097 | -0.5% | 0.13% |
| 2096 | -0.49% | 0.13% |
| 2095 | -0.48% | 0.16% |
| 2094 | -0.48% | 0.18% |
| 2093 | -0.46% | 0.21% |
| 2092 | -0.45% | 0.2% |
| 2091 | -0.44% | 0.23% |
| 2090 | -0.43% | 0.26% |
| 2089 | -0.42% | 0.28% |
| 2088 | -0.41% | 0.29% |
| 2087 | -0.4% | 0.33% |
| 2086 | -0.38% | 0.37% |
| 2085 | -0.37% | 0.38% |
| 2084 | -0.35% | 0.41% |
| 2083 | -0.35% | 0.42% |
| 2082 | -0.33% | 0.47% |
| 2081 | -0.32% | 0.46% |
| 2080 | -0.3% | 0.5% |
| 2079 | -0.28% | 0.51% |
| 2078 | -0.27% | 0.53% |
| 2077 | -0.25% | 0.56% |
| 2076 | -0.24% | 0.6% |
| 2075 | -0.23% | 0.61% |
| 2074 | -0.21% | 0.63% |
| 2073 | -0.19% | 0.66% |
| 2072 | -0.17% | 0.7% |
| 2071 | -0.16% | 0.71% |
| 2070 | -0.15% | 0.75% |
| 2069 | -0.13% | 0.78% |
| 2068 | -0.11% | 0.81% |
| 2067 | -0.09% | 0.84% |
| 2066 | -0.08% | 0.86% |
| 2065 | -0.06% | 0.89% |
| 2064 | -0.04% | 0.93% |
| 2063 | -0.02% | 0.96% |
| 2062 | -0.007% | 0.98% |
| 2061 | 0.02% | 1% |
| 2060 | 0.03% | 1.05% |
| 2059 | 0.06% | 1.1% |
| 2058 | 0.08% | 1.11% |
| 2057 | 0.09% | 1.15% |
| 2056 | 0.12% | 1.19% |
| 2055 | 0.14% | 1.21% |
| 2054 | 0.16% | 1.27% |
| 2053 | 0.18% | 1.29% |
| 2052 | 0.21% | 1.32% |
| 2051 | 0.24% | 1.35% |
| 2050 | 0.25% | 1.36% |
| 2049 | 0.27% | 1.39% |
| 2048 | 0.29% | 1.43% |
| 2047 | 0.31% | 1.47% |
| 2046 | 0.33% | 1.5% |
| 2045 | 0.35% | 1.52% |
| 2044 | 0.36% | 1.58% |
| 2043 | 0.38% | 1.61% |
| 2042 | 0.4% | 1.64% |
| 2041 | 0.42% | 1.69% |
| 2040 | 0.43% | 1.71% |
| 2039 | 0.46% | 1.73% |
| 2038 | 0.48% | 1.76% |
| 2037 | 0.5% | 1.8% |
| 2036 | 0.52% | 1.82% |
| 2035 | 0.55% | 1.83% |
| 2034 | 0.57% | 1.9% |
| 2033 | 0.59% | 1.95% |
| 2032 | 0.62% | 1.99% |
| 2031 | 0.64% | 2.06% |
| 2030 | 0.67% | 2.08% |
| 2029 | 0.7% | 2.14% |
| 2028 | 0.73% | 2.2% |
| 2027 | 0.75% | 2.23% |
| 2026 | 0.79% | 2.3% |
| 2025 | 0.81% | 2.34% |
| 2024 | 0.85% | 2.42% |
| 2023 | 0.9% | 2.49% |
| 2022 | 0.96% | 2.51% |
| 2021 | 1.05% | 2.54% |
| 2020 | 1.05% | 2.58% |
| 2019 | 1.04% | 2.59% |
| 2018 | 1.08% | 2.58% |
| 2017 | 1.09% | 2.59% |
| 2016 | 1.12% | 2.6% |
| 2015 | 1.16% | 2.56% |
| 2014 | 1.19% | 2.51% |
| 2013 | 1.23% | 2.47% |
| 2012 | 1.25% | 2.48% |
| 2011 | 1.28% | 2.51% |
| 2010 | 1.29% | 2.49% |
| 2009 | 1.28% | 2.47% |
| 2008 | 1.24% | 2.45% |
| 2007 | 1.23% | 2.34% |
| 2006 | 1.26% | 2.11% |
| 2005 | 1.32% | 2.02% |
| 2004 | 1.38% | 2.16% |
| 2003 | 1.45% | 2.27% |
| 2002 | 1.51% | 1.57% |
| 2001 | 1.59% | 1.32% |
| 2000 | 1.63% | 1.98% |
| 1999 | 1.63% | 2.27% |
| 1998 | 1.67% | 1.9% |
| 1997 | 1.76% | 2.08% |
| 1996 | 1.84% | 2.87% |
| 1995 | 1.89% | 2.83% |
| 1994 | 1.94% | 3.04% |
| 1993 | 1.98% | 3.09% |
| 1992 | 2.02% | 3.24% |
| 1991 | 2.08% | 4.08% |
| 1990 | 2.13% | 3.52% |
| 1989 | 2.14% | 2.63% |
| 1988 | 2.13% | 2.65% |
| 1987 | 2.15% | 2.6% |
| 1986 | 2.19% | 2.5% |
| 1985 | 2.25% | 2.38% |
| 1984 | 2.31% | 2.24% |
| 1983 | 2.33% | 2.14% |
| 1982 | 2.36% | 2.03% |
| 1981 | 2.43% | 1.9% |
| 1980 | 2.49% | 1.78% |
| 1979 | 2.53% | 1.67% |
| 1978 | 2.57% | 1.6% |
| 1977 | 2.61% | 1.57% |
| 1976 | 2.65% | 1.57% |
| 1975 | 2.7% | 1.6% |
| 1974 | 2.76% | 1.65% |
| 1973 | 2.8% | 1.69% |
| 1972 | 2.82% | 1.75% |
| 1971 | 2.84% | 1.82% |
| 1970 | 2.86% | 1.89% |
| 1969 | 2.88% | 1.94% |
| 1968 | 2.93% | 1.94% |
| 1967 | 2.99% | 1.92% |
| 1966 | 2.96% | 1.89% |
| 1965 | 2.99% | 1.86% |
| 1964 | 3.07% | 1.83% |
| 1963 | 3.11% | 1.81% |
| 1962 | 3.16% | 1.79% |
| 1961 | 3.21% | 1.77% |
Data sources: United Nations | World Population Prospects (2026–2100, retrieved 2026-07-08); World Bank | Health (1961–2025, retrieved 2026-07-08).
GeoRank.org/population/dominican-republic/guinea | CC BY
In 2025, the population of the Dominican Republic grew by 0.81%, while Guinea's population grew by 2.34%.
Live population counters
|
Dominican Republic
|
Guinea
|
|
|---|---|---|
| Current population |
11656588
|
15624314
|
| Population rank | 85/197 | 75/197 |
| Percent of world population | 0.14% | 0.19% |
| One net population change |
5.67 minutes
|
1.53 minutes
|
| One birth every |
2.61 minutes
|
1.07 minutes
|
| One death every |
7.36 minutes
|
3.95 minutes
|
| Daily growth/decline | +255 | +945 |
| Annual growth/decline | +92,930 | +344,942 |
| Annual growth/decline rate | +0.81% | +2.34% |
| Population growth rate rank | 111/197 | 34/197 |
| One migration net change every |
14.9 minutes
|
32.4 minutes
|
| Annual migration change | -35,306 | -16,282 |
| Net migration rank | 170/196 | 147/196 |
| Foreign-born residents | 738,667 | 117,416 |
| Foreign-born residents rank | 69/195 | 125/195 |
| Foreign-born share of population | 6.5% | 0.8% |
| Foreign-born share rank | 81/195 | 159/195 |
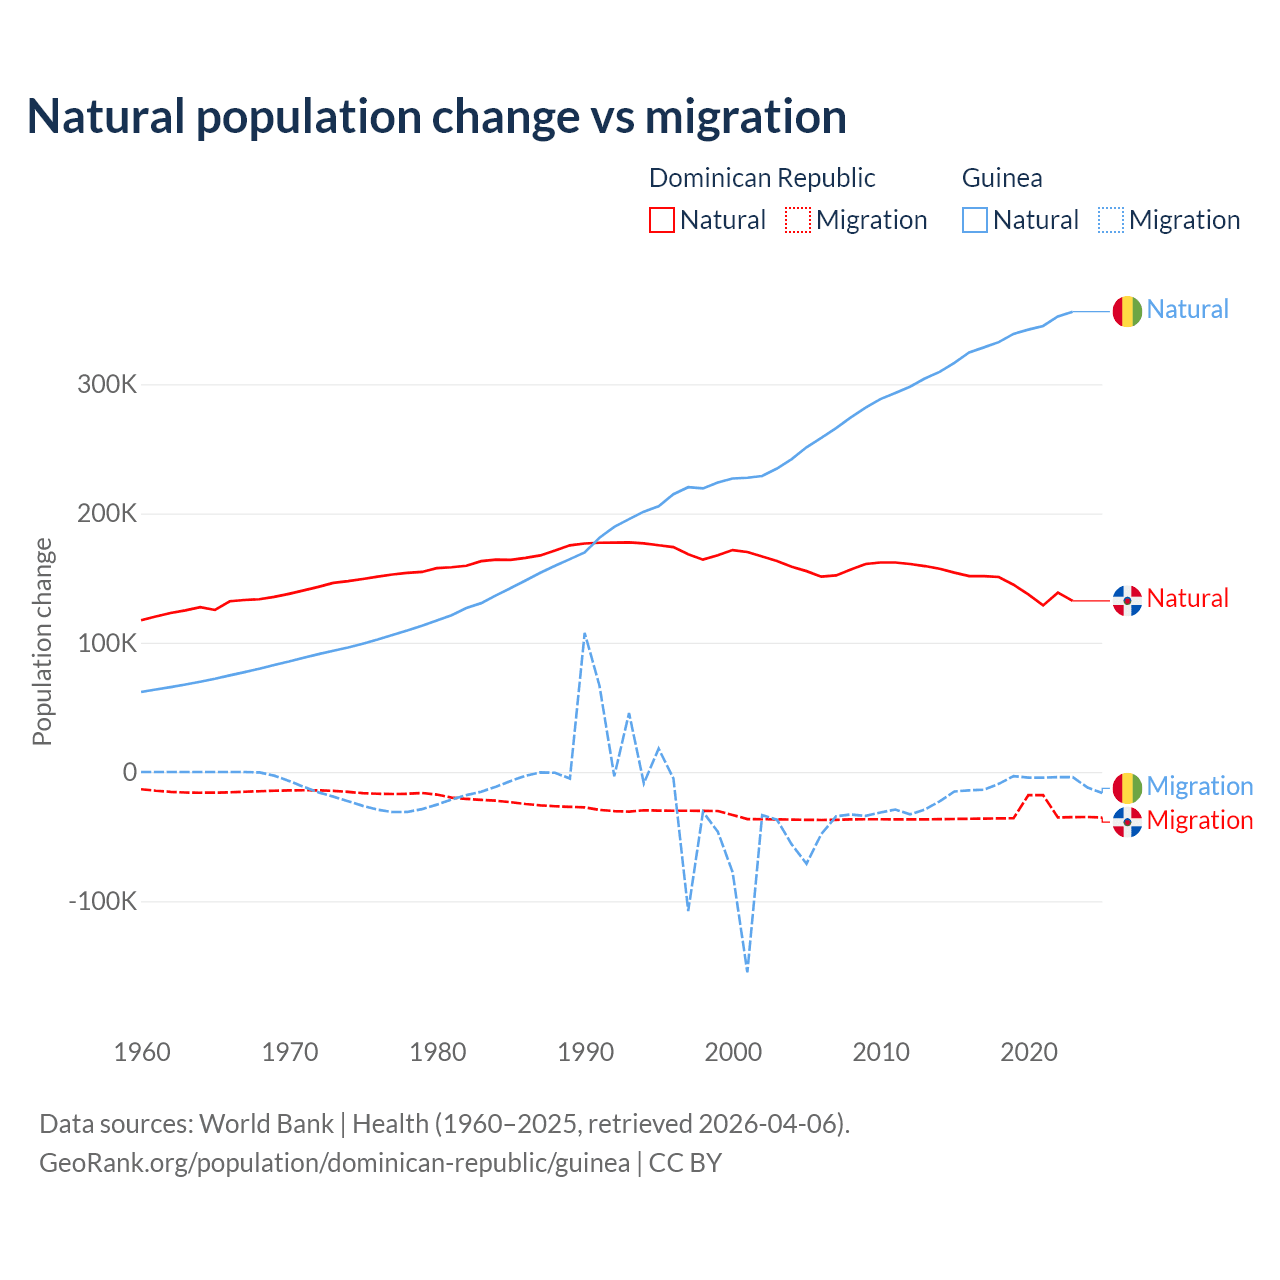
Natural population change vs migration
| Year | Population change | |||
|---|---|---|---|---|
|
Dominican Republic
|
Guinea
|
|||
| Natural | Migration | Natural | Migration | |
| 2025 | - | -35,306 | - | -16,282 |
| 2024 | 129,943 | -34,806 | 358,497 | -12,024 |
| 2023 | 132,360 | -34,915 | 356,147 | -3,997 |
| 2022 | 138,767 | -35,153 | 352,517 | -3,997 |
| 2021 | 128,866 | -17,957 | 345,121 | -4,373 |
| 2020 | 137,417 | -17,957 | 342,289 | -4,365 |
| 2019 | 144,869 | -35,797 | 338,984 | -3,240 |
| 2018 | 150,852 | -35,934 | 332,585 | -9,187 |
| 2017 | 151,565 | -36,069 | 328,542 | -13,718 |
| 2016 | 151,550 | -36,219 | 324,608 | -14,189 |
| 2015 | 154,258 | -36,375 | 316,604 | -15,117 |
| 2014 | 157,260 | -36,543 | 309,539 | -22,741 |
| 2013 | 159,330 | -36,673 | 304,430 | -29,136 |
| 2012 | 160,915 | -36,737 | 298,094 | -32,808 |
| 2011 | 162,094 | -36,687 | 293,318 | -29,069 |
| 2010 | 162,072 | -36,587 | 288,512 | -31,327 |
| 2009 | 160,893 | -36,561 | 281,920 | -34,007 |
| 2008 | 156,664 | -36,723 | 274,327 | -32,925 |
| 2007 | 152,066 | -37,076 | 266,070 | -34,311 |
| 2006 | 151,122 | -37,170 | 258,518 | -48,078 |
| 2005 | 155,405 | -37,063 | 251,209 | -71,015 |
| 2004 | 158,789 | -36,851 | 242,075 | -56,036 |
| 2003 | 163,267 | -36,657 | 234,774 | -36,934 |
| 2002 | 166,740 | -36,575 | 229,022 | -33,450 |
| 2001 | 170,193 | -36,441 | 227,642 | -155,020 |
| 2000 | 171,684 | -33,256 | 227,081 | -77,450 |
| 1999 | 167,742 | -30,228 | 223,968 | -46,183 |
| 1998 | 164,287 | -30,108 | 219,385 | -30,903 |
| 1997 | 168,419 | -30,034 | 220,373 | -107,614 |
| 1996 | 174,008 | -30,018 | 214,896 | -4,973 |
| 1995 | 175,439 | -29,873 | 205,644 | 18,021 |
| 1994 | 176,882 | -29,610 | 201,439 | -8,826 |
| 1993 | 177,691 | -30,719 | 195,612 | 45,616 |
| 1992 | 177,481 | -30,262 | 189,682 | -3,285 |
| 1991 | 177,371 | -29,351 | 181,299 | 66,718 |
| 1990 | 176,748 | -27,397 | 169,926 | 107,641 |
| 1989 | 175,365 | -26,984 | 164,707 | -5,150 |
| 1988 | 171,291 | -26,552 | 159,566 | -637 |
| 1987 | 167,552 | -25,850 | 154,178 | -350 |
| 1986 | 165,674 | -24,772 | 148,137 | -2,900 |
| 1985 | 164,091 | -23,388 | 142,313 | -6,965 |
| 1984 | 164,263 | -22,239 | 136,640 | -11,439 |
| 1983 | 163,136 | -21,582 | 130,629 | -15,265 |
| 1982 | 159,597 | -20,886 | 126,831 | -17,920 |
| 1981 | 158,419 | -19,809 | 121,223 | -21,367 |
| 1980 | 157,697 | -17,485 | 117,186 | -25,287 |
| 1979 | 154,779 | -16,296 | 113,141 | -28,770 |
| 1978 | 154,043 | -16,909 | 109,415 | -30,933 |
| 1977 | 152,825 | -17,077 | 105,990 | -31,004 |
| 1976 | 151,201 | -16,866 | 102,449 | -29,220 |
| 1975 | 149,339 | -16,425 | 99,267 | -26,221 |
| 1974 | 147,652 | -15,402 | 96,315 | -22,637 |
| 1973 | 146,283 | -14,594 | 93,764 | -19,065 |
| 1972 | 143,255 | -14,262 | 91,147 | -15,782 |
| 1971 | 140,473 | -14,156 | 88,358 | -11,543 |
| 1970 | 137,835 | -14,255 | 85,418 | -6,906 |
| 1969 | 135,445 | -14,531 | 82,799 | -2,844 |
| 1968 | 133,666 | -14,901 | 79,892 | -345 |
| 1967 | 133,091 | -15,324 | 77,251 | 0 |
| 1966 | 132,096 | -15,701 | 74,748 | 0 |
| 1965 | 125,345 | -15,978 | 72,134 | 0 |
| 1964 | 127,504 | -16,059 | 69,848 | 0 |
| 1963 | 124,994 | -15,889 | 67,690 | 0 |
| 1962 | 122,977 | -15,389 | 65,672 | 0 |
| 1961 | 120,316 | -14,511 | 63,766 | 0 |
| 1960 | 117,346 | -13,344 | 61,848 | 0 |
Data sources: World Bank | Health (1960–2025, retrieved 2026-07-08).
GeoRank.org/population/dominican-republic/guinea | CC BY
Over the last 10 years, 81.6% of the population change in the Dominican Republic is from natural causes (a gain of 1,420,447 people) and 18.4% is from migration (a loss of 321,182 people). In Guinea 97.6% is from natural causes (a gain of 3,395,894 people) and 2.42% is from migration (a loss of 84,207 people).
As of 2024, 738,667 residents or 6.5% of the population were not native-born in the Dominican Republic, compared to 117,416 people or 0.8% in Guinea.
Biggest cities by population
|
Dominican Republic
|
|
|---|---|
| City | Population |
| Santo Domingo | 2.2M |
| Santiago de los Caballeros | 1.34M |
| Puerto Plata | 338K |
| La Vega | 282K |
| Higuey | 251K |
| San Cristobal | 233K |
| San Pedro de Macoris | 217K |
| San Francisco de Macoris | 188K |
| San Juan de la Maguana | 169K |
| Bonao | 158K |
|
Guinea
|
|
|---|---|
| City | Population |
| Conakry | 1.67M |
| Mamou | 376K |
| Nzerekore | 316K |
| Gueckedou | 222K |
| Kankan | 191K |
| Boffa | 48.3K |
| Forecariah | 23K |
Compare countries by 7 more topics
Population differences between the Dominican Republic and Guinea
|
Dominican Republic
|
Guinea
|
|
|---|---|---|
| Life expectancy | 74.1 years | 61.2 years |
| Average age | 32 years | 23.5 years |
| Median age | 29.3 years | 19.3 years |
| Male:Female ratio | 49.7:50.3 | 49.5:50.5 |
| Fertility rate | 2.22 births per woman | 4.13 births per woman |
| Population density | 624 ppl/mi² | 162.8 ppl/mi² |
Population map with other countries
Data sources: World Bank | Health (1960–2025, retrieved 2026-07-08); United Nations | World Population Prospects (1960–2026, retrieved 2026-07-08); U.S. Census Bureau (1960–2025, retrieved 2026-07-08); Central Intelligence Agency (CIA) (2000–2019, retrieved 2026-07-08).
GeoRank.org/population/dominican-republic/guinea | CC BY
Help us show the world through your eyes
Share a photo of your city and help others discover what it looks like to live there. Your contribution makes our data come alive.
Data sources:
- World Bank | Health (1960–2025, retrieved 2026-07-08)
- United Nations | World Population Prospects (1960–2100, retrieved 2026-07-08)
- U.S. Census Bureau (1960–2025, retrieved 2026-07-08)
- Central Intelligence Agency (CIA) (2000–2019, retrieved 2026-07-08)
- Wikidata (2026, retrieved 2026-07-08)
Creative Commons Attribution (CC BY) — you’re free to copy, share, remix, adapt, and use even commercially as long as you give appropriate credit and clearly indicate if you made changes. Other sources may be subject to different license terms.