The United States is slightly bigger by total area compared to China: 3,794,100 sq mi vs 3,705,407 sq mi. Without inland water, the land area of China is 3,624,808 sq mi vs 3,531,839 sq mi for the United States.
- China ranks 4/197 by total surface area vs 3/197 for the United States.
- China occupies 6.3% of the land mass of all countries, compared with 6.14% for the United States.
- 55.4% of China's area is agricultural land vs 46.1% in the United States.
- China has 10.9% of the world's agricultural land area — the US has 8.8%.
- 24% of China is covered by forests, compared to 33.9% in the US.
- 5.59% of the world's forests are in China, and 7.68% are in the United States.
Total size and land area comparison
 China
China
|
 United States
|
|
|---|---|---|
| Total area |
3,705,407 sq mi |
3,794,100 sq mi |
| Size difference ratio | 1 | 1.02 |
| Total area rank | 4/197 | 3/197 |
| Share of all countries' surface area | 1.88% | 1.93% |
| Land area |
3,624,808 sq mi |
3,531,839 sq mi |
| Land area difference ratio | 1.03 | 1 |
| Land area rank | 2/197 | 3/197 |
| Share of all countries' land area | 6.3% | 6.14% |
| Population | 1,406,585,000 | 341,784,857 |
| Population density | 387 ppl/mi² | 97.3 ppl/mi² |
Surface area by type
|
China
|
United States
|
|
|---|---|---|
| Forest area |
871,112 sq mi |
1,196,125 sq mi |
| Forest area as share of land | 24% | 33.9% |
| Forest area rank | 5/196 | 4/196 |
| World's forests share | 5.59% | 7.68% |
Agricultural land area

|
2,009,326 sq mi |
1,627,576 sq mi |
| Agricultural land share | 55.4% | 46.1% |
| Agricultural land area rank | 1/194 | 2/194 |
| Share of global agricultural land | 10.9% | 8.8% |
|
Arable land
|
418,639 sq mi |
585,190 sq mi |
| Arable land share | 11.5% | 16.6% |
| Arable land area rank | 4/191 | 2/191 |
|
Permanent cropland
|
73,950 sq mi |
12,242 sq mi |
| Permanent cropland share | 2.04% | 0.35% |
| Permanent cropland area rank | 2/192 | 14/192 |
|
Water area
|
80,599 sq mi |
262,262 sq mi |
| Water as share of total area | 2.18% | 6.91% |
| Water area rank | 5/197 | 3/197 |
| Roads length |
3,411,576 mi |
4,092,730 mi |
| Land borders length |
13,954 mi |
7,458 mi |
| Coastline length |
9,010 mi |
12,380 mi |
| Share of marine protected waters | 4.8% | 19% |
Size of China compared to states in USA
If China were a state in the US, it would be the biggest of all: 6.35 times the size of Alaska, 13.9 of Texas, and 23.3 times bigger than California.
| # | State | Land area |
Compared to
China |
|---|---|---|---|
| * |
China |
3,624,808 sq mi | * |
| 1 | Alaska | 570,641 sq mi | 0.16 |
| 2 | Texas | 261,232 sq mi | 0.07 |
| 3 | California | 155,779 sq mi | 0.04 |
| 4 | Montana | 145,546 sq mi | 0.04 |
| 5 | New Mexico | 121,298 sq mi | 0.03 |
| 6 | Arizona | 113,594 sq mi | 0.03 |
| 7 | Nevada | 109,781 sq mi | 0.03 |
| 8 | Colorado | 103,642 sq mi | 0.03 |
| 9 | Wyoming | 97,093 sq mi | 0.03 |
| 10 | Oregon | 95,988 sq mi | 0.03 |
| 11 | Idaho | 82,643 sq mi | 0.02 |
| 12 | Utah | 82,169 sq mi | 0.02 |
| 13 | Kansas | 81,759 sq mi | 0.02 |
| 14 | Minnesota | 79,627 sq mi | 0.02 |
| 15 | Nebraska | 76,824 sq mi | 0.02 |
| 16 | South Dakota | 75,811 sq mi | 0.02 |
| 17 | North Dakota | 69,001 sq mi | 0.02 |
| 18 | Missouri | 68,742 sq mi | 0.02 |
| 19 | Oklahoma | 68,595 sq mi | 0.02 |
| 20 | Washington | 66,456 sq mi | 0.02 |
| 21 | Georgia | 57,513 sq mi | 0.02 |
| 22 | Michigan | 56,539 sq mi | 0.02 |
| 23 | Iowa | 55,857 sq mi | 0.02 |
| 24 | Illinois | 55,519 sq mi | 0.02 |
| 25 | Wisconsin | 54,158 sq mi | 0.01 |
| 26 | Florida | 53,625 sq mi | 0.01 |
| 27 | Arkansas | 52,035 sq mi | 0.01 |
| 28 | Alabama | 50,645 sq mi | 0.01 |
| 29 | North Carolina | 48,618 sq mi | 0.01 |
| 30 | New York | 47,126 sq mi | 0.01 |
| 31 | Mississippi | 46,923 sq mi | 0.01 |
| 32 | Pennsylvania | 44,743 sq mi | 0.01 |
| 33 | Louisiana | 43,204 sq mi | 0.01 |
| 34 | Tennessee | 41,235 sq mi | 0.01 |
| 35 | Ohio | 40,861 sq mi | 0.01 |
| 36 | Virginia | 39,490 sq mi | 0.01 |
| 37 | Kentucky | 39,486 sq mi | 0.01 |
| 38 | Indiana | 35,826 sq mi | 0.01 |
| 39 | Maine | 30,843 sq mi | 0.009 |
| 40 | South Carolina | 30,061 sq mi | 0.008 |
| 41 | West Virginia | 24,038 sq mi | 0.007 |
| 42 | Maryland | 9,707 sq mi | 0.003 |
| 43 | Vermont | 9,217 sq mi | 0.003 |
| 44 | New Hampshire | 8,953 sq mi | 0.002 |
| 45 | Massachusetts | 7,800 sq mi | 0.002 |
| 46 | New Jersey | 7,354 sq mi | 0.002 |
| 47 | Hawaii | 6,423 sq mi | 0.002 |
| 48 | Connecticut | 4,842 sq mi | 0.001 |
| 49 | Puerto Rico | 3,459 sq mi | 0.001 |
| 50 | Delaware | 1,949 sq mi | 0.0005 |
| 51 | Rhode Island | 1,045 sq mi | 0.0003 |
| 52 | Guam | 209.7 sq mi | 0.00006 |
| 53 | Northern Mariana Islands | 179.2 sq mi | 0.00005 |
| 54 | US Virgin Islands | 133.7 sq mi | 0.00004 |
| 55 | American Samoa | 76.4 sq mi | 0.00002 |
| 56 | District of Columbia | 61 sq mi | 0.00002 |
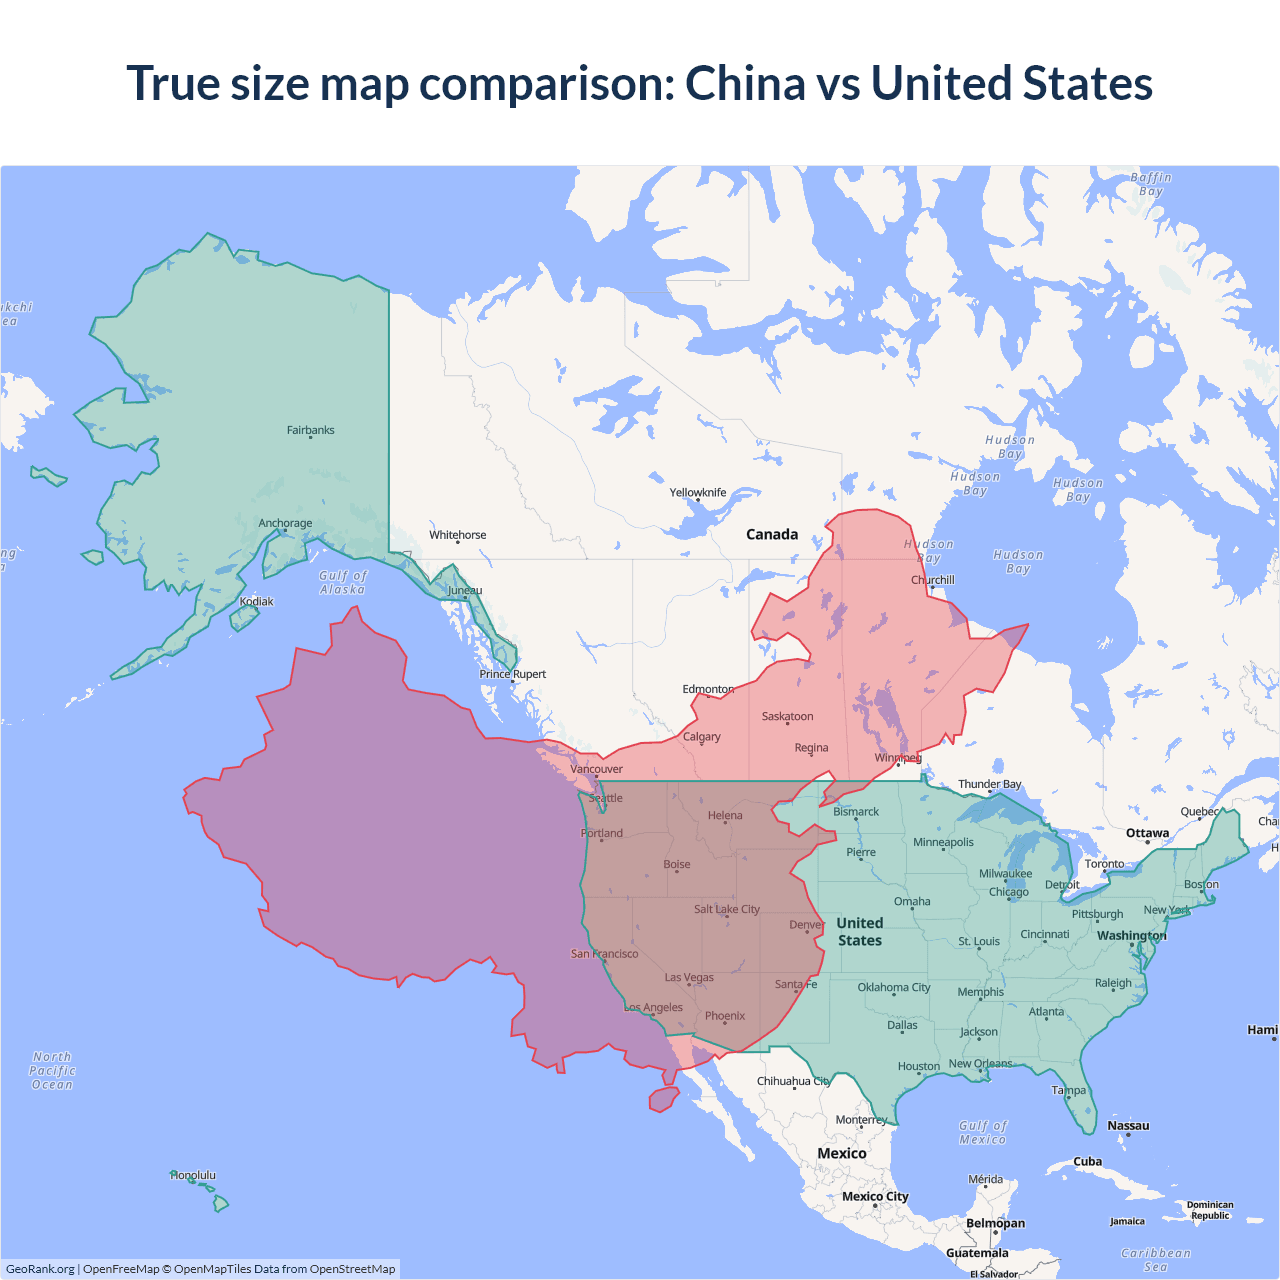
China vs United States size on the map
Data sources: World Bank | Agriculture & Rural Development (2026, retrieved 2026-07-08).
GeoRank.org/size/china/united-states | CC BY
The map above outlines the borders of China and the United States but is not accurate for size comparison because it's a 2d map with Mercator projection that distorts territories near the poles. The farther a country is from the equator, the more magnified it appears. More about country size projections.
Compare countries by 7 more topics
Help us show the world through your eyes
Share a photo of your city and help others discover what it looks like to live there. Your contribution makes our data come alive.
Data sources:
- World Bank | Agriculture & Rural Development (2023–2026, retrieved 2026-07-08)
- Wikidata (2026, retrieved 2026-07-08)
- Central Intelligence Agency (CIA) (2025, retrieved 2026-07-08)
- United Nations | World Population Prospects (2026, retrieved 2026-07-08)
- U.S. Census Bureau (2025, retrieved 2026-07-08)
Total agricultural land encompasses all areas used for agriculture: territories under permanent and temporary crops and pastures. It includes land under flowering shrubs, fruit and nut trees, and vineyards, but excludes sites utilized for timber production.
Arable land encompasses fields utilized for temporary crop production, pastures, market or kitchen gardens, and temporarily fallowed land. Land abandoned due to shifting cultivation practices is not included.
Permanent cropland refers to farmland for the long-term cultivation of crops, such as coffee, cocoa, and rubber, which do not require replanting after each harvest. This category encompasses land with permanent crops like flowering shrubs, fruit and nut trees, and vines, but does not include land under trees for timber production.
Inland areas under water, such as large rivers, lakes, and some coastal waterways.
Creative Commons Attribution (CC BY) — you’re free to copy, share, remix, adapt, and use even commercially as long as you give appropriate credit and clearly indicate if you made changes. Other sources may be subject to different license terms.