The latest officially reported population of Brazil was 212,812,405 in 2025 vs 75,844 people in the Cayman Islands in 2025. In 2026, based on the adjusted UN estimation, the current Brazil's population is 213,964,342 people compared to 77,917 in the Cayman Islands.
Population statistics:
- Brazil's population is 2,746 times bigger than the Cayman Islands'.
- Brazil is ranked the 7th most populous country in the world, while the Cayman Islands is the 187th.
- The countries together account for 2.58% of the world: 2.57% for Brazil vs 0.0009% for the Cayman Islands.
- For the last 10 years, Brazil has had an average growth rate of +0.56% per year vs +2.13% in the Cayman Islands.
- Since 2006, the population of Brazil has increased from 187M people to 214M (14.6% growth), while the Cayman Islands has grown from 48.2K to 77.9K (61.5% growth).
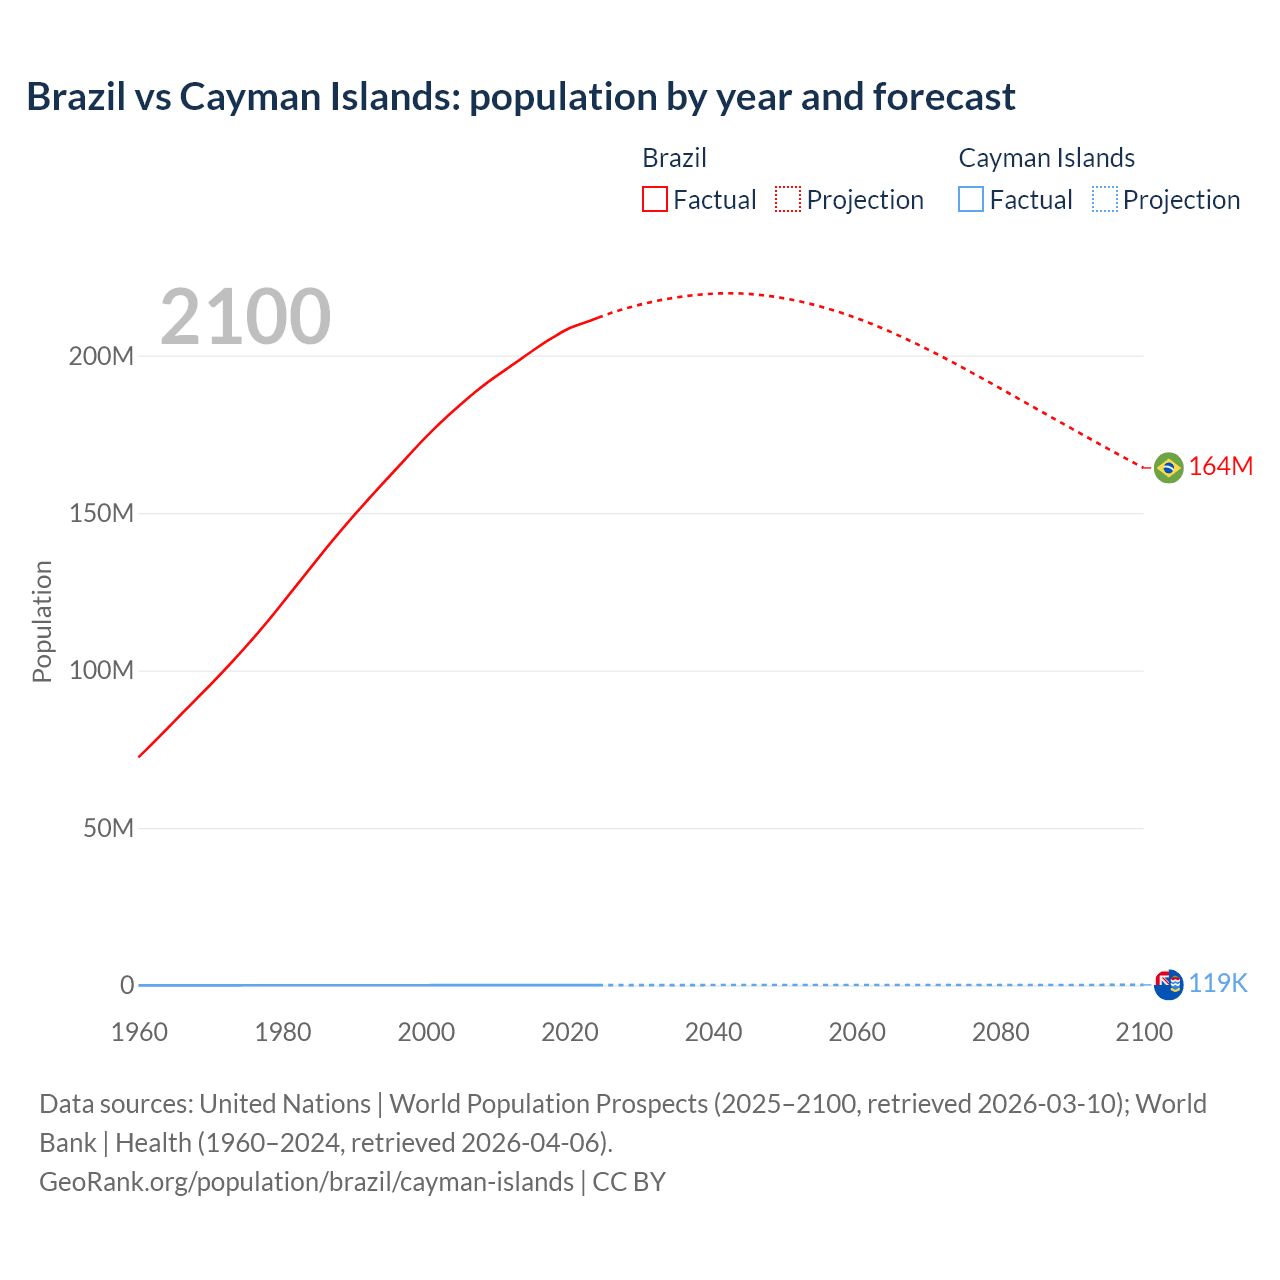
Brazil vs Cayman Islands: population by year and forecast
| Year | Population | |
|---|---|---|
 Brazil
|
 Cayman Islands
|
|
| 2100 | 164,266,855 | 119,150 |
| 2099 | 165,476,254 | 119,178 |
| 2098 | 166,696,264 | 119,218 |
| 2097 | 167,929,414 | 119,188 |
| 2096 | 169,170,182 | 119,152 |
| 2095 | 170,418,279 | 119,094 |
| 2094 | 171,673,285 | 119,012 |
| 2093 | 172,929,867 | 118,929 |
| 2092 | 174,196,660 | 118,819 |
| 2091 | 175,465,250 | 118,645 |
| 2090 | 176,741,676 | 118,489 |
| 2089 | 178,016,467 | 118,390 |
| 2088 | 179,298,655 | 118,298 |
| 2087 | 180,582,637 | 118,168 |
| 2086 | 181,869,555 | 118,045 |
| 2085 | 183,154,436 | 117,899 |
| 2084 | 184,439,572 | 117,740 |
| 2083 | 185,726,230 | 117,587 |
| 2082 | 187,015,781 | 117,430 |
| 2081 | 188,304,247 | 117,288 |
| 2080 | 189,585,345 | 117,160 |
| 2079 | 190,860,450 | 117,000 |
| 2078 | 192,128,265 | 116,877 |
| 2077 | 193,387,405 | 116,656 |
| 2076 | 194,635,237 | 116,480 |
| 2075 | 195,871,705 | 116,308 |
| 2074 | 197,098,086 | 116,079 |
| 2073 | 198,312,538 | 115,896 |
| 2072 | 199,508,048 | 115,606 |
| 2071 | 200,684,948 | 115,356 |
| 2070 | 201,838,290 | 115,053 |
| 2069 | 202,969,511 | 114,758 |
| 2068 | 204,078,136 | 114,420 |
| 2067 | 205,156,343 | 114,105 |
| 2066 | 206,210,336 | 113,810 |
| 2065 | 207,233,670 | 113,519 |
| 2064 | 208,223,021 | 113,187 |
| 2063 | 209,184,325 | 112,814 |
| 2062 | 210,111,930 | 112,403 |
| 2061 | 211,000,165 | 111,986 |
| 2060 | 211,851,790 | 111,513 |
| 2059 | 212,667,148 | 110,988 |
| 2058 | 213,439,165 | 110,415 |
| 2057 | 214,172,487 | 109,853 |
| 2056 | 214,860,969 | 109,139 |
| 2055 | 215,511,064 | 108,436 |
| 2054 | 216,119,176 | 107,727 |
| 2053 | 216,684,051 | 106,986 |
| 2052 | 217,203,400 | 106,236 |
| 2051 | 217,673,624 | 105,360 |
| 2050 | 218,102,997 | 104,451 |
| 2049 | 218,492,176 | 103,606 |
| 2048 | 218,825,106 | 102,653 |
| 2047 | 219,107,600 | 101,731 |
| 2046 | 219,337,375 | 100,784 |
| 2045 | 219,518,678 | 99,791 |
| 2044 | 219,643,532 | 98,788 |
| 2043 | 219,714,087 | 97,721 |
| 2042 | 219,730,173 | 96,637 |
| 2041 | 219,688,816 | 95,542 |
| 2040 | 219,589,786 | 94,404 |
| 2039 | 219,450,960 | 93,283 |
| 2038 | 219,263,564 | 92,149 |
| 2037 | 219,033,555 | 91,002 |
| 2036 | 218,758,565 | 89,845 |
| 2035 | 218,441,478 | 88,706 |
| 2034 | 218,079,673 | 87,539 |
| 2033 | 217,677,081 | 86,306 |
| 2032 | 217,230,117 | 85,083 |
| 2031 | 216,739,295 | 83,804 |
| 2030 | 216,202,357 | 82,526 |
| 2029 | 215,618,762 | 81,242 |
| 2028 | 214,992,547 | 79,922 |
| 2027 | 214,315,680 | 78,573 |
| 2026 | 213,593,266 | 77,225 |
| 2025 | 212,812,405 | 75,844 |
| 2024 | 211,998,573 | 74,457 |
| 2023 | 211,140,729 | 73,038 |
| 2022 | 210,306,415 | 71,591 |
| 2021 | 209,550,294 | 70,108 |
| 2020 | 208,660,842 | 68,684 |
| 2019 | 207,455,459 | 67,327 |
| 2018 | 206,107,261 | 65,941 |
| 2017 | 204,703,445 | 64,535 |
| 2016 | 203,218,114 | 63,100 |
| 2015 | 201,675,532 | 61,642 |
| 2014 | 200,085,127 | 60,160 |
| 2013 | 198,478,299 | 58,655 |
| 2012 | 196,876,111 | 57,136 |
| 2011 | 195,284,734 | 55,606 |
| 2010 | 193,701,929 | 54,099 |
| 2009 | 192,079,951 | 52,618 |
| 2008 | 190,367,302 | 51,151 |
| 2007 | 188,552,320 | 49,687 |
| 2006 | 186,653,106 | 48,232 |
| 2005 | 184,688,101 | 46,788 |
| 2004 | 182,675,143 | 45,352 |
| 2003 | 180,622,688 | 43,934 |
| 2002 | 178,503,484 | 42,514 |
| 2001 | 176,301,203 | 41,089 |
| 2000 | 174,018,282 | 39,674 |
| 1999 | 171,641,543 | 38,284 |
| 1998 | 169,159,655 | 36,922 |
| 1997 | 166,661,659 | 35,543 |
| 1996 | 164,202,549 | 34,143 |
| 1995 | 161,735,073 | 32,743 |
| 1994 | 159,265,006 | 31,352 |
| 1993 | 156,794,577 | 29,976 |
| 1992 | 154,275,079 | 28,621 |
| 1991 | 151,724,256 | 27,294 |
| 1990 | 149,143,223 | 25,999 |
| 1989 | 146,502,972 | 24,874 |
| 1988 | 143,826,357 | 23,951 |
| 1987 | 141,104,944 | 23,073 |
| 1986 | 138,336,370 | 22,197 |
| 1985 | 135,515,595 | 21,324 |
| 1984 | 132,658,864 | 20,454 |
| 1983 | 129,790,077 | 19,598 |
| 1982 | 126,923,155 | 18,750 |
| 1981 | 124,063,109 | 17,905 |
| 1980 | 121,207,461 | 17,079 |
| 1979 | 118,380,821 | 16,351 |
| 1978 | 115,600,942 | 15,727 |
| 1977 | 112,875,292 | 15,105 |
| 1976 | 110,213,349 | 14,454 |
| 1975 | 107,619,565 | 13,788 |
| 1974 | 105,089,675 | 13,114 |
| 1973 | 102,600,976 | 12,438 |
| 1972 | 100,146,797 | 11,764 |
| 1971 | 97,739,273 | 11,098 |
| 1970 | 95,375,651 | 10,517 |
| 1969 | 93,045,777 | 10,165 |
| 1968 | 90,741,240 | 9,971 |
| 1967 | 88,446,124 | 9,769 |
| 1966 | 86,139,359 | 9,560 |
| 1965 | 83,817,583 | 9,361 |
| 1964 | 81,488,595 | 9,166 |
| 1963 | 79,164,235 | 8,970 |
| 1962 | 76,865,323 | 8,781 |
| 1961 | 74,605,447 | 8,601 |
| 1960 | 72,388,126 | 8,428 |
Data sources: United Nations | World Population Prospects (2026–2100, retrieved 2026-07-08); World Bank | Health (1960–2025, retrieved 2026-07-08).
GeoRank.org/population/brazil/cayman-islands | CC BY 
From 2006 to 2016, the population of Brazil increased by 16,565,008 people (a 8.87% growth), while the Cayman Islands gained 14,868 people (a 30.8% growth).
For the next 10 years, from 2016 to 2026, Brazil gained 10,746,228 people (a 5.29% growth), while the Cayman Islands' population increased by 14,817 people (a 23.5% growth).
Brazil was ranked 5th most populous country in 2006 and is 7th in 2026. The Cayman Islands was ranked 189th in 2006 and ranked 187th now.
The UN's World Population Prospects forecasts that in 24 years (in 2050) Brazil's population will grow by 1.93% to 218,102,997 people with a rank change from 7th to 9th. The population of the Cayman Islands will increase by 34.1% to 104,451 people and rank change from 187th to 184th.
Brazil is projected to reach its peak in 2042 at 220M people compared to the peak of 119K people in 2098 for the Cayman Islands.
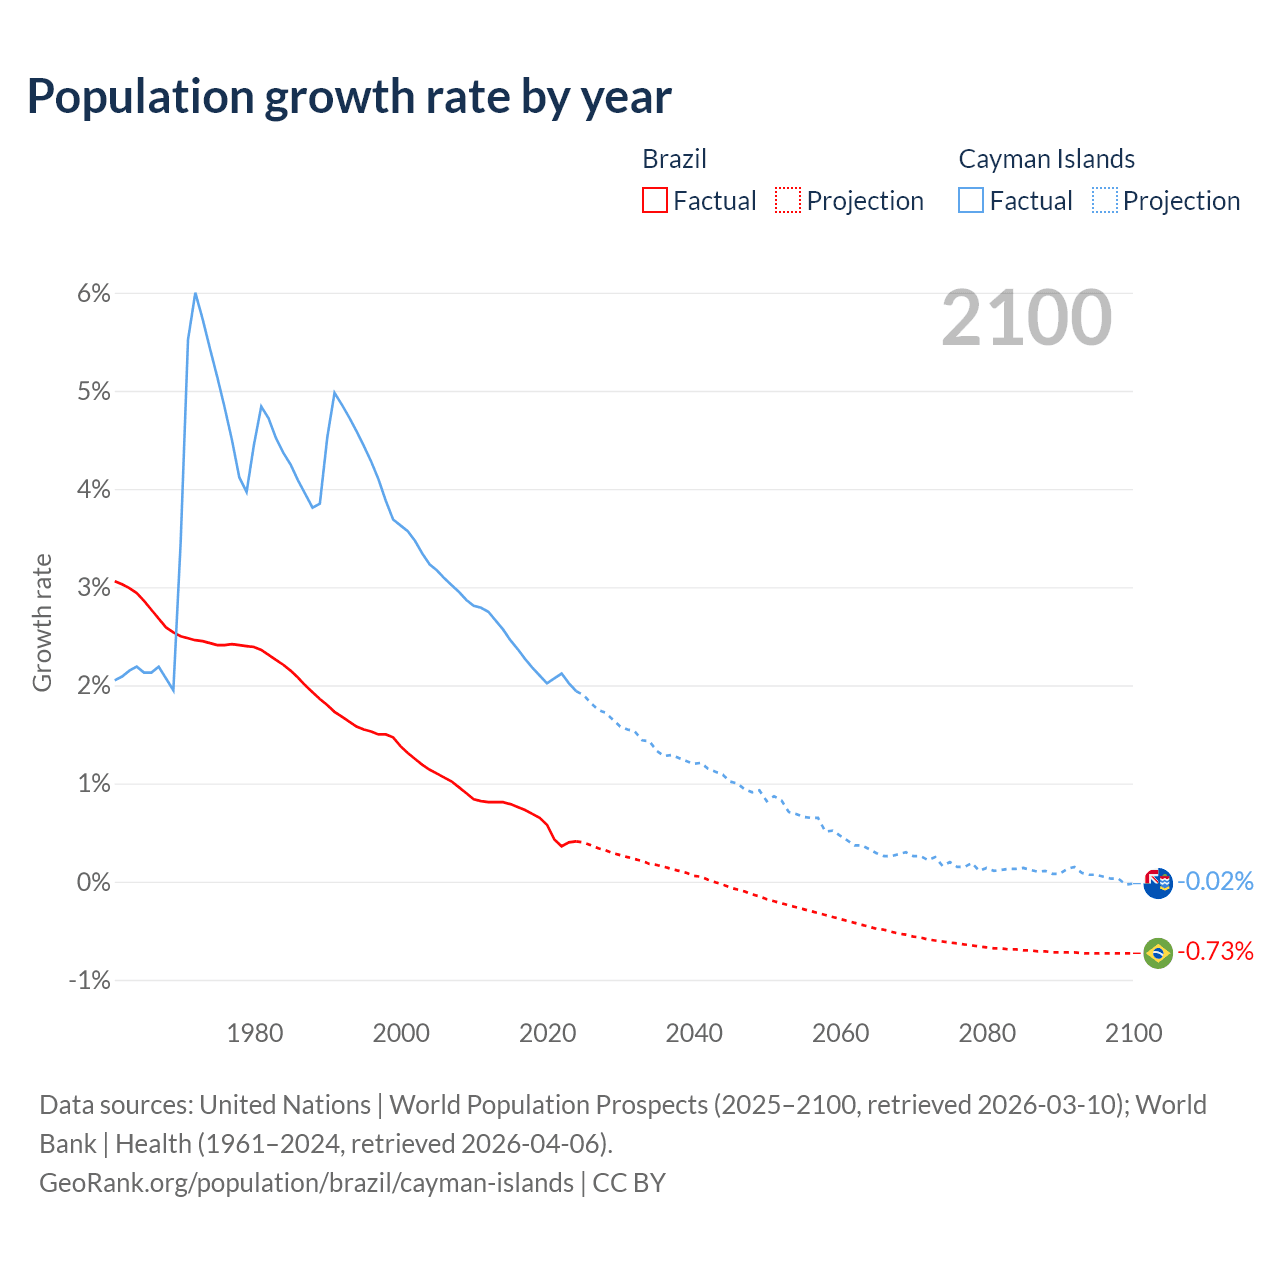
Population growth rate by year
| Year | Growth rate | |
|---|---|---|
|
Brazil
|
Cayman Islands
|
|
| 2100 | -0.73% | -0.02% |
| 2099 | -0.73% | -0.03% |
| 2098 | -0.73% | 0.03% |
| 2097 | -0.73% | 0.03% |
| 2096 | -0.73% | 0.05% |
| 2095 | -0.73% | 0.07% |
| 2094 | -0.73% | 0.07% |
| 2093 | -0.73% | 0.09% |
| 2092 | -0.72% | 0.15% |
| 2091 | -0.72% | 0.13% |
| 2090 | -0.72% | 0.08% |
| 2089 | -0.72% | 0.08% |
| 2088 | -0.71% | 0.11% |
| 2087 | -0.71% | 0.1% |
| 2086 | -0.7% | 0.12% |
| 2085 | -0.7% | 0.14% |
| 2084 | -0.69% | 0.13% |
| 2083 | -0.69% | 0.13% |
| 2082 | -0.68% | 0.12% |
| 2081 | -0.68% | 0.11% |
| 2080 | -0.67% | 0.14% |
| 2079 | -0.66% | 0.11% |
| 2078 | -0.65% | 0.19% |
| 2077 | -0.64% | 0.15% |
| 2076 | -0.63% | 0.15% |
| 2075 | -0.62% | 0.2% |
| 2074 | -0.61% | 0.16% |
| 2073 | -0.6% | 0.25% |
| 2072 | -0.59% | 0.22% |
| 2071 | -0.57% | 0.26% |
| 2070 | -0.56% | 0.26% |
| 2069 | -0.54% | 0.3% |
| 2068 | -0.53% | 0.28% |
| 2067 | -0.51% | 0.26% |
| 2066 | -0.49% | 0.26% |
| 2065 | -0.48% | 0.29% |
| 2064 | -0.46% | 0.33% |
| 2063 | -0.44% | 0.37% |
| 2062 | -0.42% | 0.37% |
| 2061 | -0.4% | 0.42% |
| 2060 | -0.38% | 0.47% |
| 2059 | -0.36% | 0.52% |
| 2058 | -0.34% | 0.51% |
| 2057 | -0.32% | 0.65% |
| 2056 | -0.3% | 0.65% |
| 2055 | -0.28% | 0.66% |
| 2054 | -0.26% | 0.69% |
| 2053 | -0.24% | 0.71% |
| 2052 | -0.22% | 0.83% |
| 2051 | -0.2% | 0.87% |
| 2050 | -0.18% | 0.82% |
| 2049 | -0.15% | 0.93% |
| 2048 | -0.13% | 0.91% |
| 2047 | -0.1% | 0.94% |
| 2046 | -0.08% | 1% |
| 2045 | -0.06% | 1.02% |
| 2044 | -0.03% | 1.09% |
| 2043 | -0.007% | 1.12% |
| 2042 | 0.02% | 1.15% |
| 2041 | 0.05% | 1.21% |
| 2040 | 0.06% | 1.2% |
| 2039 | 0.09% | 1.23% |
| 2038 | 0.11% | 1.26% |
| 2037 | 0.13% | 1.29% |
| 2036 | 0.15% | 1.28% |
| 2035 | 0.17% | 1.33% |
| 2034 | 0.18% | 1.43% |
| 2033 | 0.21% | 1.44% |
| 2032 | 0.23% | 1.53% |
| 2031 | 0.25% | 1.55% |
| 2030 | 0.27% | 1.58% |
| 2029 | 0.29% | 1.65% |
| 2028 | 0.32% | 1.72% |
| 2027 | 0.34% | 1.75% |
| 2026 | 0.37% | 1.82% |
| 2025 | 0.38% | 1.86% |
| 2024 | 0.41% | 1.94% |
| 2023 | 0.4% | 2.02% |
| 2022 | 0.36% | 2.12% |
| 2021 | 0.43% | 2.07% |
| 2020 | 0.58% | 2.02% |
| 2019 | 0.65% | 2.1% |
| 2018 | 0.69% | 2.18% |
| 2017 | 0.73% | 2.27% |
| 2016 | 0.76% | 2.37% |
| 2015 | 0.79% | 2.46% |
| 2014 | 0.81% | 2.57% |
| 2013 | 0.81% | 2.66% |
| 2012 | 0.81% | 2.75% |
| 2011 | 0.82% | 2.79% |
| 2010 | 0.84% | 2.81% |
| 2009 | 0.9% | 2.87% |
| 2008 | 0.96% | 2.95% |
| 2007 | 1.02% | 3.02% |
| 2006 | 1.06% | 3.09% |
| 2005 | 1.1% | 3.17% |
| 2004 | 1.14% | 3.23% |
| 2003 | 1.19% | 3.34% |
| 2002 | 1.25% | 3.47% |
| 2001 | 1.31% | 3.57% |
| 2000 | 1.38% | 3.63% |
| 1999 | 1.47% | 3.69% |
| 1998 | 1.5% | 3.88% |
| 1997 | 1.5% | 4.1% |
| 1996 | 1.53% | 4.28% |
| 1995 | 1.55% | 4.44% |
| 1994 | 1.58% | 4.59% |
| 1993 | 1.63% | 4.73% |
| 1992 | 1.68% | 4.86% |
| 1991 | 1.73% | 4.98% |
| 1990 | 1.8% | 4.52% |
| 1989 | 1.86% | 3.85% |
| 1988 | 1.93% | 3.81% |
| 1987 | 2% | 3.95% |
| 1986 | 2.08% | 4.09% |
| 1985 | 2.15% | 4.25% |
| 1984 | 2.21% | 4.37% |
| 1983 | 2.26% | 4.52% |
| 1982 | 2.31% | 4.72% |
| 1981 | 2.36% | 4.84% |
| 1980 | 2.39% | 4.45% |
| 1979 | 2.4% | 3.97% |
| 1978 | 2.41% | 4.12% |
| 1977 | 2.42% | 4.5% |
| 1976 | 2.41% | 4.83% |
| 1975 | 2.41% | 5.14% |
| 1974 | 2.43% | 5.43% |
| 1973 | 2.45% | 5.73% |
| 1972 | 2.46% | 6% |
| 1971 | 2.48% | 5.52% |
| 1970 | 2.5% | 3.46% |
| 1969 | 2.54% | 1.95% |
| 1968 | 2.59% | 2.07% |
| 1967 | 2.68% | 2.19% |
| 1966 | 2.77% | 2.13% |
| 1965 | 2.86% | 2.13% |
| 1964 | 2.94% | 2.19% |
| 1963 | 2.99% | 2.15% |
| 1962 | 3.03% | 2.09% |
| 1961 | 3.06% | 2.05% |
Data sources: United Nations | World Population Prospects (2026–2100, retrieved 2026-07-08); World Bank | Health (1961–2025, retrieved 2026-07-08).
GeoRank.org/population/brazil/cayman-islands | CC BY
In 2025, the population of Brazil grew by 0.38%, while the Cayman Islands' population grew by 1.86%.
Live population counters
|
Brazil
|
Cayman Islands
|
|
|---|---|---|
| Current population |
213964342
|
77917
|
| Population rank | 7/197 | 187/197 |
| Percent of world population | 2.57% | 0.0009% |
| One net population change |
38.9 seconds
|
6.33 hours
|
| One birth every |
12.3 seconds
|
10.2 hours
|
| One death every |
21 seconds
|
1.01 days
|
| Daily growth/decline | +2,230 | +4 |
| Annual growth/decline | +813,832 | +1,387 |
| Annual growth/decline rate | +0.38% | +1.86% |
| Population growth rate rank | 141/197 | 56/197 |
| One migration net change every |
2.43 minutes
|
9.89 hours
|
| Annual migration change | -217,283 | +888 |
| Net migration rank | 186/196 | 65/196 |
| Foreign-born residents | 1,406,299 | 31,935 |
| Foreign-born residents rank | 48/195 | 162/195 |
| Foreign-born share of population | 0.7% | 42.9% |
| Foreign-born share rank | 163/195 | 13/195 |
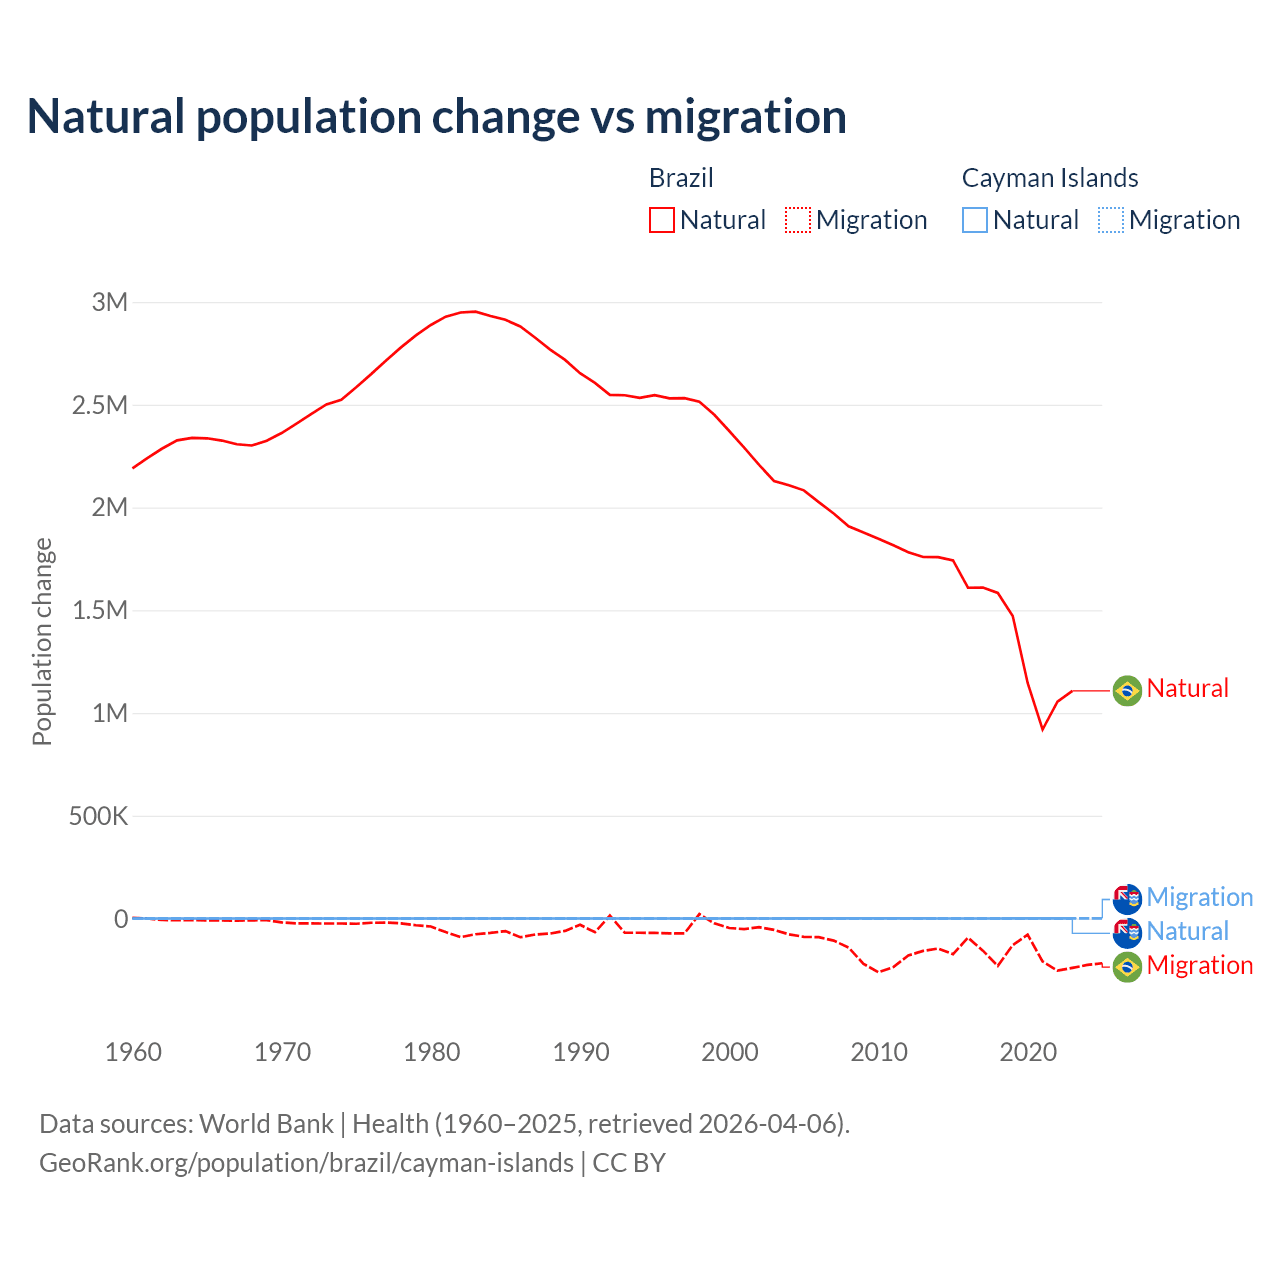
Natural population change vs migration
| Year | Population change | |||
|---|---|---|---|---|
|
Brazil
|
Cayman Islands
|
|||
| Natural | Migration | Natural | Migration | |
| 2025 | - | -217,283 | - | 888 |
| 2024 | 1,073,773 | -225,510 | 498 | 896 |
| 2023 | 1,107,434 | -240,059 | 514 | 921 |
| 2022 | 1,054,897 | -253,639 | 527 | 942 |
| 2021 | 919,507 | -208,581 | 533 | 965 |
| 2020 | 1,146,174 | -78,437 | 539 | 810 |
| 2019 | 1,472,104 | -129,216 | 514 | 859 |
| 2018 | 1,583,935 | -230,334 | 383 | 1,011 |
| 2017 | 1,610,402 | -156,296 | 351 | 1,065 |
| 2016 | 1,609,488 | -92,989 | 351 | 1,094 |
| 2015 | 1,742,275 | -173,611 | 364 | 1,107 |
| 2014 | 1,757,948 | -145,732 | 392 | 1,105 |
| 2013 | 1,758,716 | -157,228 | 439 | 1,077 |
| 2012 | 1,782,516 | -179,707 | 468 | 1,060 |
| 2011 | 1,815,758 | -235,860 | 503 | 1,024 |
| 2010 | 1,847,336 | -261,539 | 515 | 978 |
| 2009 | 1,878,542 | -220,207 | 513 | 951 |
| 2008 | 1,908,051 | -141,056 | 490 | 975 |
| 2007 | 1,970,372 | -107,481 | 468 | 990 |
| 2006 | 2,026,119 | -90,634 | 451 | 997 |
| 2005 | 2,083,281 | -88,868 | 439 | 1,002 |
| 2004 | 2,108,072 | -76,661 | 426 | 1,004 |
| 2003 | 2,128,819 | -55,350 | 416 | 1,003 |
| 2002 | 2,207,017 | -42,008 | 407 | 1,019 |
| 2001 | 2,291,210 | -51,600 | 400 | 1,026 |
| 2000 | 2,372,043 | -45,800 | 392 | 1,021 |
| 1999 | 2,450,869 | -23,497 | 394 | 960 |
| 1998 | 2,514,728 | 21,666 | 392 | 974 |
| 1997 | 2,531,758 | -72,392 | 387 | 1,004 |
| 1996 | 2,530,690 | -71,943 | 377 | 1,026 |
| 1995 | 2,546,195 | -69,963 | 362 | 1,039 |
| 1994 | 2,532,951 | -68,961 | 343 | 1,042 |
| 1993 | 2,545,874 | -69,070 | 325 | 1,040 |
| 1992 | 2,547,698 | 14,394 | 320 | 1,020 |
| 1991 | 2,606,167 | -66,600 | 327 | 982 |
| 1990 | 2,652,959 | -30,555 | 284 | 998 |
| 1989 | 2,717,923 | -60,023 | 269 | 700 |
| 1988 | 2,768,082 | -72,825 | 233 | 646 |
| 1987 | 2,825,485 | -77,800 | 214 | 663 |
| 1986 | 2,880,440 | -90,973 | 227 | 649 |
| 1985 | 2,912,908 | -60,879 | 225 | 646 |
| 1984 | 2,931,496 | -70,035 | 216 | 649 |
| 1983 | 2,952,335 | -76,322 | 206 | 648 |
| 1982 | 2,948,552 | -90,766 | 217 | 629 |
| 1981 | 2,928,262 | -65,971 | 255 | 578 |
| 1980 | 2,887,768 | -38,918 | 232 | 588 |
| 1979 | 2,836,759 | -32,503 | 210 | 425 |
| 1978 | 2,778,815 | -23,416 | 195 | 413 |
| 1977 | 2,715,328 | -19,478 | 184 | 456 |
| 1976 | 2,648,647 | -20,612 | 180 | 484 |
| 1975 | 2,585,130 | -25,499 | 181 | 492 |
| 1974 | 2,524,254 | -24,093 | 184 | 493 |
| 1973 | 2,501,309 | -24,071 | 216 | 460 |
| 1972 | 2,454,698 | -23,584 | 292 | 375 |
| 1971 | 2,407,319 | -23,421 | 158 | 500 |
| 1970 | 2,362,073 | -18,779 | 219 | 294 |
| 1969 | 2,324,190 | -7,763 | 139 | 43 |
| 1968 | 2,301,561 | -8,856 | 167 | 39 |
| 1967 | 2,307,560 | -10,033 | 168 | 41 |
| 1966 | 2,325,332 | -9,317 | 167 | 37 |
| 1965 | 2,336,415 | -8,824 | 168 | 28 |
| 1964 | 2,338,478 | -8,146 | 179 | 16 |
| 1963 | 2,326,400 | -8,136 | 191 | 1 |
| 1962 | 2,286,666 | -7,171 | 192 | -6 |
| 1961 | 2,240,178 | 75 | 188 | -7 |
| 1960 | 2,190,392 | 4,066 | 180 | -24 |
Data sources: World Bank | Health (1960–2025, retrieved 2026-07-08).
GeoRank.org/population/brazil/cayman-islands | CC BY
Over the last 10 years, 88.2% of the population change in Brazil is from natural causes (a gain of 13,319,989 people) and 11.8% is from migration (a loss of 1,788,672 people). In the Cayman Islands 32.1% is from natural causes (a gain of 4,574 people) and 67.9% is from migration (a gain of 9,670 people).
As of 2024, 1,406,299 residents or 0.7% of the population were not native-born in Brazil, compared to 31,935 people or 42.9% in the Cayman Islands.
Biggest cities by population
|
Brazil
|
|
|---|---|
| City | Population |
| Sao Paulo | 11.5M |
| Rio de Janeiro | 6.21M |
| Brasilia | 3M |
| Fortaleza | 2.58M |
| Salvador | 2.42M |
| Belo Horizonte | 2.32M |
| Manaus | 2.3M |
| Curitiba | 1.77M |
| Recife | 1.49M |
| Goiania | 1.44M |
|
Cayman Islands
|
|
|---|---|
| City | Population |
| George Town | 40.2K |
Compare countries by 7 more topics
Population differences between Brazil and the Cayman Islands
|
Brazil
|
Cayman Islands
|
|
|---|---|---|
| Life expectancy | 76.4 years | 80.9 years |
| Average age | 36.7 years | 38.7 years |
| Median age | 35.8 years | 39.7 years |
| Male:Female ratio | 49.2:50.8 | 50.2:49.8 |
| Fertility rate | 1.61 births per woman | 1.53 births per woman |
| Population density | 66.2 ppl/mi² | 833 ppl/mi² |
Population map with other countries
Data sources: World Bank | Health (1960–2025, retrieved 2026-07-08); United Nations | World Population Prospects (1960–2026, retrieved 2026-07-08); U.S. Census Bureau (1960–2025, retrieved 2026-07-08); Central Intelligence Agency (CIA) (2000–2019, retrieved 2026-07-08).
GeoRank.org/population/brazil/cayman-islands | CC BY
Help us show the world through your eyes
Share a photo of your city and help others discover what it looks like to live there. Your contribution makes our data come alive.
Data sources:
- World Bank | Health (1960–2025, retrieved 2026-07-08)
- United Nations | World Population Prospects (1960–2100, retrieved 2026-07-08)
- U.S. Census Bureau (1960–2025, retrieved 2026-07-08)
- Central Intelligence Agency (CIA) (2000–2019, retrieved 2026-07-08)
- Wikidata (2026, retrieved 2026-07-08)
Creative Commons Attribution (CC BY) — you’re free to copy, share, remix, adapt, and use even commercially as long as you give appropriate credit and clearly indicate if you made changes. Other sources may be subject to different license terms.