The DR Congo is 76.4 times bigger by total area compared to Belgium: 905,355 sq mi vs 11,849 sq mi. Without inland water, the land area of the DR Congo is 875,313 sq mi vs 11,774 sq mi for Belgium — a 74.3 times difference in territory size.
- Belgium ranks 137/197 by total surface area vs 11/197 for the DR Congo.
- Belgium occupies 0.02% of the land mass of all countries, compared with 1.52% for the DR Congo.
- 44.4% of Belgium's area is agricultural land vs 15.5% in the DR Congo.
- Belgium has 0.03% of the world's agricultural land area — the DR Congo has 0.73%.
- 22.6% of Belgium is covered by forests, compared to 54.2% in the DR Congo.
- 0.02% of the world's forests are in Belgium, and 3.04% are in the DR Congo.
Total size and land area comparison
 Belgium
|
 DR Congo
|
|
|---|---|---|
| Total area |
11,849 sq mi |
905,355 sq mi |
| Size difference ratio | 1 | 76.4 |
| Total area rank | 137/197 | 11/197 |
| Share of all countries' surface area | 0.006% | 0.46% |
| Land area |
11,774 sq mi |
875,313 sq mi |
| Land area difference ratio | 1 | 74.3 |
| Land area rank | 136/197 | 11/197 |
| Share of all countries' land area | 0.02% | 1.52% |
| Population | 11,941,781 | 112,832,473 |
| Population density | 1,016 ppl/mi² | 133.1 ppl/mi² |
Surface area by type
|
Belgium
|
DR Congo
|
|
|---|---|---|
| Forest area |
2,661 sq mi |
474,331 sq mi |
| Forest area as share of land | 22.6% | 54.2% |
| Forest area rank | 133/196 | 7/196 |
| World's forests share | 0.02% | 3.04% |
Agricultural land area

|
5,225 sq mi |
135,505 sq mi |
| Agricultural land share | 44.4% | 15.5% |
| Agricultural land area rank | 133/194 | 37/194 |
| Share of global agricultural land | 0.03% | 0.73% |
|
Arable land
|
3,333 sq mi |
57,521 sq mi |
| Arable land share | 28.3% | 6.57% |
| Arable land area rank | 112/191 | 22/191 |
|
Permanent cropland
|
89.6 sq mi |
7,714 sq mi |
| Permanent cropland share | 0.76% | 0.88% |
| Permanent cropland area rank | 145/192 | 24/192 |
|
Water area
|
74.9 sq mi |
30,042 sq mi |
| Water as share of total area | 0.63% | 3.32% |
| Water area rank | 129/197 | 10/197 |
| Roads length |
73,579 mi |
94,680 mi |
| Land borders length |
806 mi |
6,852 mi |
| Coastline length |
41.3 mi |
23 mi |
| Share of marine protected waters | 38.3% | 0.5% |
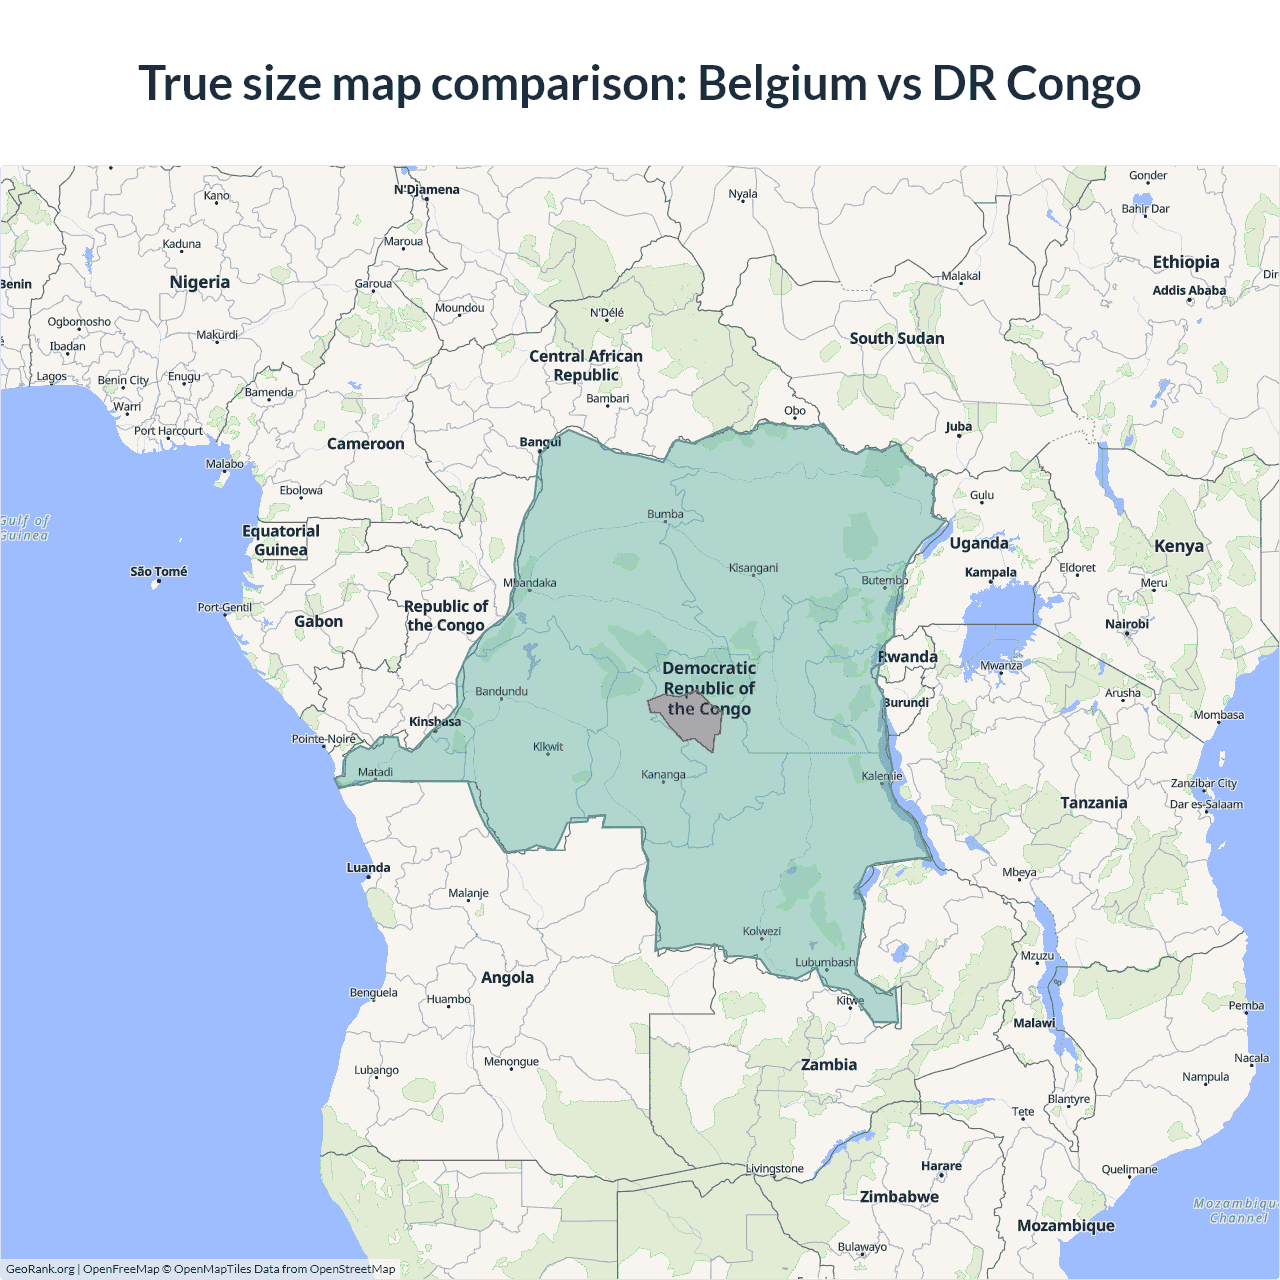
Belgium vs DR Congo size on the map
Data sources: World Bank | Agriculture & Rural Development (2026, retrieved 2026-07-08).
GeoRank.org/size/belgium/dr-congo | CC BY
The map above outlines the borders of Belgium and the DR Congo but is not accurate for size comparison because it's a 2d map with Mercator projection that distorts territories near the poles. The farther a country is from the equator, the more magnified it appears. More about country size projections.
Compare countries by 7 more topics
Help us show the world through your eyes
Share a photo of your city and help others discover what it looks like to live there. Your contribution makes our data come alive.
Data sources:
- World Bank | Agriculture & Rural Development (2023–2026, retrieved 2026-07-08)
- Wikidata (2026, retrieved 2026-07-08)
- Central Intelligence Agency (CIA) (2025, retrieved 2026-07-08)
- United Nations | World Population Prospects (2026, retrieved 2026-07-08)
Total agricultural land encompasses all areas used for agriculture: territories under permanent and temporary crops and pastures. It includes land under flowering shrubs, fruit and nut trees, and vineyards, but excludes sites utilized for timber production.
Arable land encompasses fields utilized for temporary crop production, pastures, market or kitchen gardens, and temporarily fallowed land. Land abandoned due to shifting cultivation practices is not included.
Permanent cropland refers to farmland for the long-term cultivation of crops, such as coffee, cocoa, and rubber, which do not require replanting after each harvest. This category encompasses land with permanent crops like flowering shrubs, fruit and nut trees, and vines, but does not include land under trees for timber production.
Inland areas under water, such as large rivers, lakes, and some coastal waterways.
Creative Commons Attribution (CC BY) — you’re free to copy, share, remix, adapt, and use even commercially as long as you give appropriate credit and clearly indicate if you made changes. Other sources may be subject to different license terms.