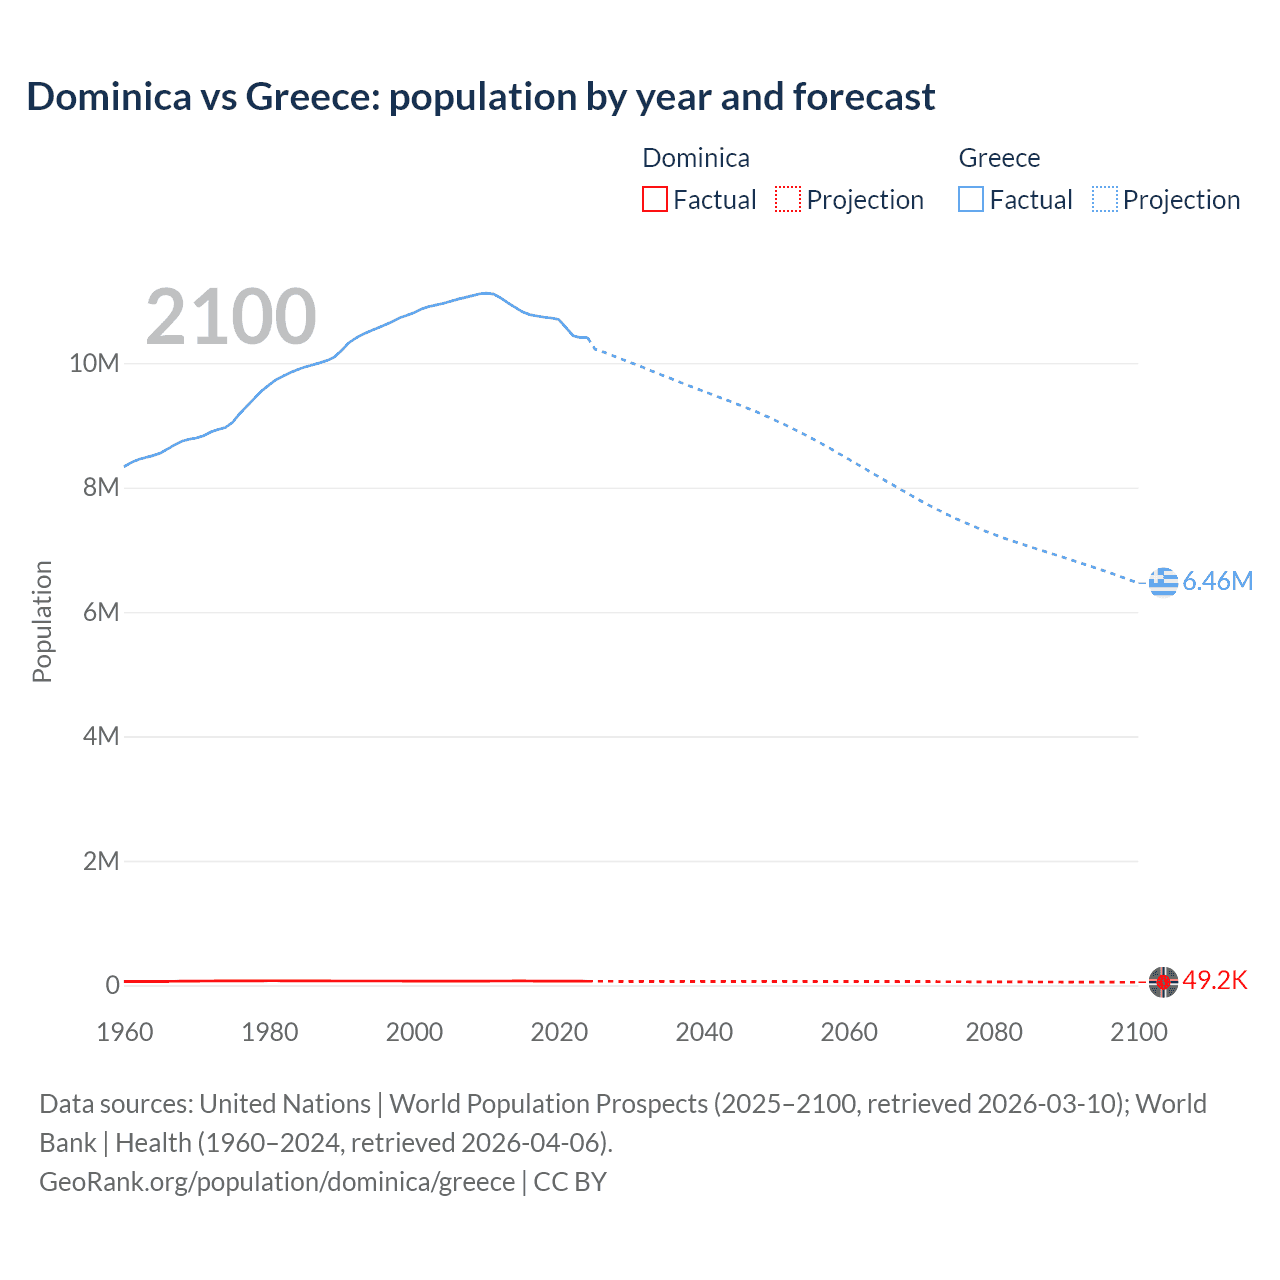
The latest officially reported population of Dominica was 65,871 in 2025 vs 10,413,962 people in Greece in 2025. In 2026, based on the adjusted UN estimation, the current Dominica's population is 65,501 people compared to 10,371,575 in Greece.
Population statistics:
- Greece's population is 158.3 times bigger than Dominica's.
- Dominica is ranked the 188th most populous country in the world, while Greece is the 94th.
- The countries together account for 0.13% of the world: 0.0008% for Dominica vs 0.12% for Greece.
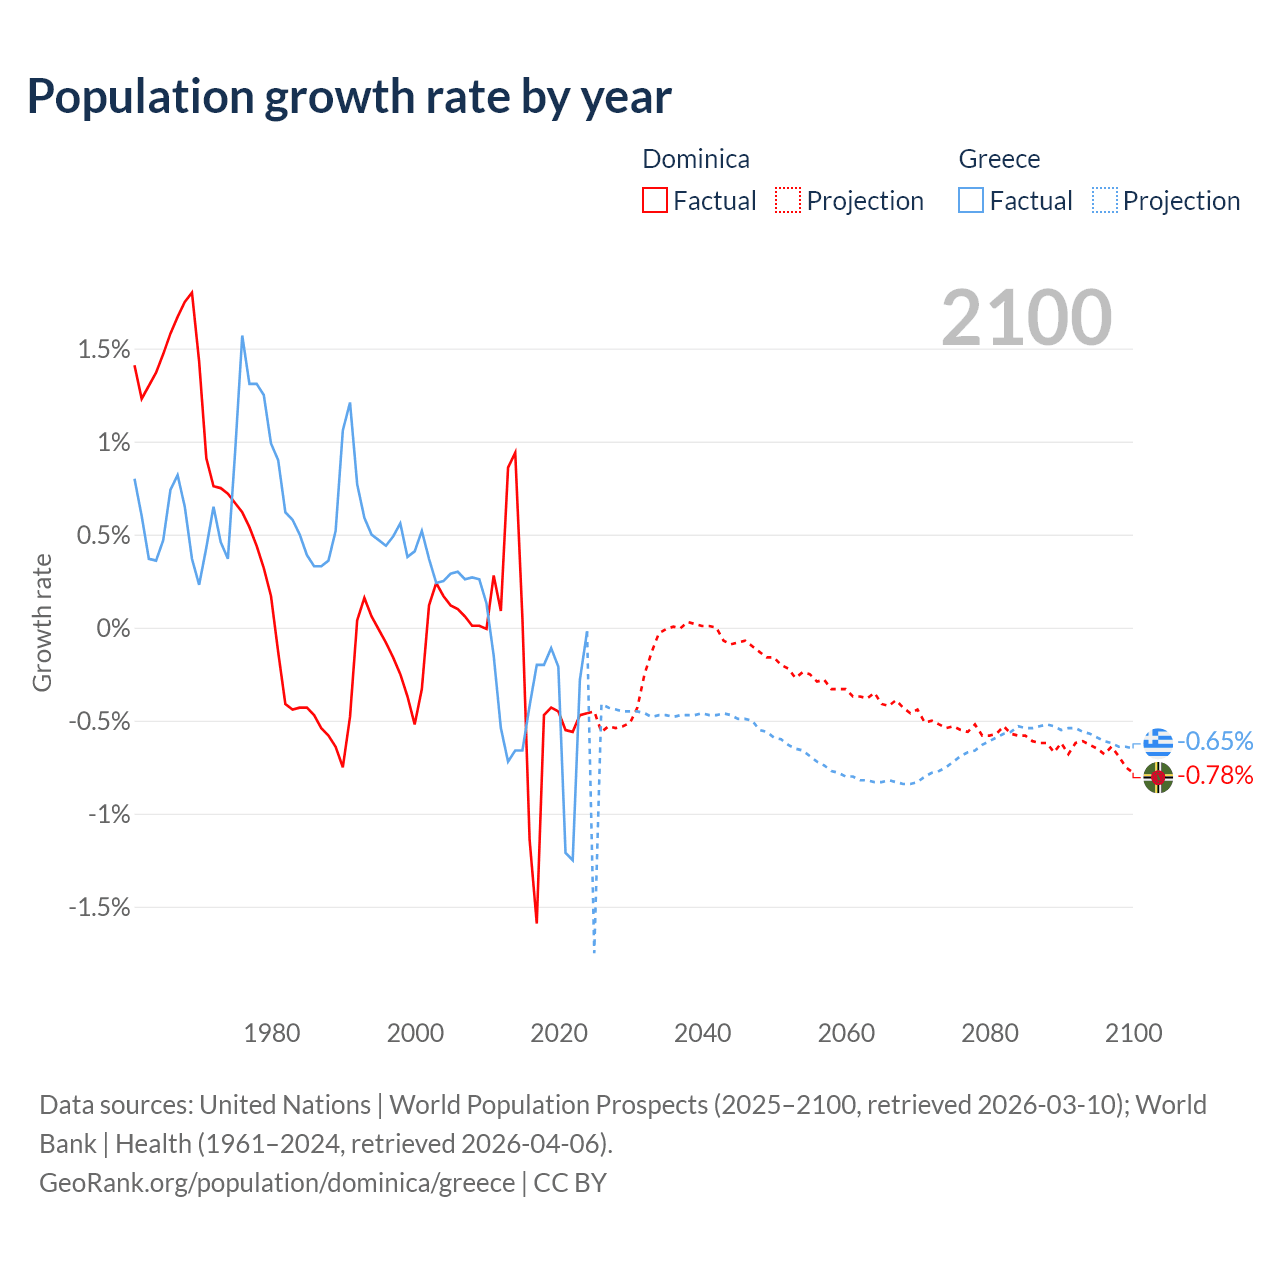
- For the last 10 years, Dominica has had an average growth rate of -0.6% per year vs -0.41% in Greece.
- Since 2006, the population of Dominica has decreased from 68.8K people to 65.5K (4.8% decline), while Greece has declined from 11M to 10.4M (5.89% decline).
Dominica vs Greece: population by year and forecast
| Year | Population | |
|---|---|---|
 Dominica
|
 Greece
|
|
| 2100 | 49,161 | 6,583,798 |
| 2099 | 49,550 | 6,626,788 |
| 2098 | 49,923 | 6,669,448 |
| 2097 | 50,272 | 6,712,148 |
| 2096 | 50,597 | 6,754,327 |
| 2095 | 50,943 | 6,795,603 |
| 2094 | 51,277 | 6,836,072 |
| 2093 | 51,604 | 6,875,572 |
| 2092 | 51,918 | 6,914,370 |
| 2091 | 52,241 | 6,952,243 |
| 2090 | 52,598 | 6,990,331 |
| 2089 | 52,927 | 7,028,964 |
| 2088 | 53,285 | 7,066,683 |
| 2087 | 53,620 | 7,103,695 |
| 2086 | 53,952 | 7,141,616 |
| 2085 | 54,281 | 7,180,403 |
| 2084 | 54,596 | 7,219,180 |
| 2083 | 54,912 | 7,257,814 |
| 2082 | 55,227 | 7,298,443 |
| 2081 | 55,523 | 7,340,066 |
| 2080 | 55,844 | 7,383,894 |
| 2079 | 56,168 | 7,429,047 |
| 2078 | 56,496 | 7,475,929 |
| 2077 | 56,790 | 7,525,653 |
| 2076 | 57,109 | 7,576,476 |
| 2075 | 57,427 | 7,629,016 |
| 2074 | 57,735 | 7,684,147 |
| 2073 | 58,050 | 7,742,105 |
| 2072 | 58,352 | 7,802,307 |
| 2071 | 58,648 | 7,863,855 |
| 2070 | 58,947 | 7,927,670 |
| 2069 | 59,206 | 7,993,717 |
| 2068 | 59,480 | 8,061,488 |
| 2067 | 59,737 | 8,129,716 |
| 2066 | 59,970 | 8,198,001 |
| 2065 | 60,221 | 8,265,902 |
| 2064 | 60,471 | 8,334,739 |
| 2063 | 60,683 | 8,404,367 |
| 2062 | 60,914 | 8,473,829 |
| 2061 | 61,141 | 8,543,564 |
| 2060 | 61,369 | 8,612,080 |
| 2059 | 61,575 | 8,681,422 |
| 2058 | 61,776 | 8,749,623 |
| 2057 | 61,982 | 8,817,088 |
| 2056 | 62,158 | 8,882,878 |
| 2055 | 62,341 | 8,947,611 |
| 2054 | 62,498 | 9,010,135 |
| 2053 | 62,647 | 9,070,133 |
| 2052 | 62,815 | 9,129,136 |
| 2051 | 62,952 | 9,186,935 |
| 2050 | 63,075 | 9,242,128 |
| 2049 | 63,179 | 9,297,265 |
| 2048 | 63,280 | 9,349,392 |
| 2047 | 63,365 | 9,400,970 |
| 2046 | 63,425 | 9,448,620 |
| 2045 | 63,472 | 9,495,447 |
| 2044 | 63,524 | 9,542,082 |
| 2043 | 63,580 | 9,587,391 |
| 2042 | 63,622 | 9,631,428 |
| 2041 | 63,622 | 9,676,515 |
| 2040 | 63,616 | 9,721,977 |
| 2039 | 63,610 | 9,767,381 |
| 2038 | 63,598 | 9,813,639 |
| 2037 | 63,581 | 9,860,147 |
| 2036 | 63,583 | 9,906,540 |
| 2035 | 63,580 | 9,953,900 |
| 2034 | 63,585 | 10,000,716 |
| 2033 | 63,604 | 10,047,814 |
| 2032 | 63,689 | 10,096,329 |
| 2031 | 63,850 | 10,142,892 |
| 2030 | 64,125 | 10,189,114 |
| 2029 | 64,454 | 10,235,303 |
| 2028 | 64,797 | 10,281,352 |
| 2027 | 65,152 | 10,326,692 |
| 2026 | 65,501 | 10,371,575 |
| 2025 | 65,871 | 10,413,962 |
| 2024 | 66,205 | 10,405,134 |
| 2023 | 66,510 | 10,407,351 |
| 2022 | 66,826 | 10,437,805 |
| 2021 | 67,202 | 10,570,130 |
| 2020 | 67,573 | 10,698,599 |
| 2019 | 67,880 | 10,721,582 |
| 2018 | 68,174 | 10,732,882 |
| 2017 | 68,496 | 10,754,679 |
| 2016 | 69,606 | 10,775,971 |
| 2015 | 70,410 | 10,820,883 |
| 2014 | 70,373 | 10,892,413 |
| 2013 | 69,715 | 10,965,211 |
| 2012 | 69,118 | 11,045,011 |
| 2011 | 69,053 | 11,104,899 |
| 2010 | 68,859 | 11,121,341 |
| 2009 | 68,864 | 11,107,017 |
| 2008 | 68,854 | 11,077,841 |
| 2007 | 68,847 | 11,048,473 |
| 2006 | 68,806 | 11,020,362 |
| 2005 | 68,734 | 10,987,314 |
| 2004 | 68,649 | 10,955,141 |
| 2003 | 68,531 | 10,928,070 |
| 2002 | 68,367 | 10,902,022 |
| 2001 | 68,288 | 10,862,132 |
| 2000 | 68,511 | 10,805,808 |
| 1999 | 68,870 | 10,761,698 |
| 1998 | 69,124 | 10,720,509 |
| 1997 | 69,299 | 10,661,259 |
| 1996 | 69,410 | 10,608,800 |
| 1995 | 69,469 | 10,562,153 |
| 1994 | 69,477 | 10,512,922 |
| 1993 | 69,433 | 10,460,415 |
| 1992 | 69,325 | 10,399,061 |
| 1991 | 69,296 | 10,319,927 |
| 1990 | 69,627 | 10,196,792 |
| 1989 | 70,153 | 10,089,498 |
| 1988 | 70,608 | 10,036,983 |
| 1987 | 71,023 | 10,000,595 |
| 1986 | 71,406 | 9,967,213 |
| 1985 | 71,744 | 9,934,300 |
| 1984 | 72,056 | 9,895,801 |
| 1983 | 72,365 | 9,846,627 |
| 1982 | 72,688 | 9,789,513 |
| 1981 | 72,986 | 9,729,350 |
| 1980 | 73,083 | 9,642,505 |
| 1979 | 72,959 | 9,548,258 |
| 1978 | 72,724 | 9,429,959 |
| 1977 | 72,406 | 9,308,479 |
| 1976 | 72,017 | 9,188,150 |
| 1975 | 71,570 | 9,046,541 |
| 1974 | 71,091 | 8,962,022 |
| 1973 | 70,585 | 8,929,086 |
| 1972 | 70,060 | 8,888,628 |
| 1971 | 69,532 | 8,831,036 |
| 1970 | 68,908 | 8,792,806 |
| 1969 | 67,934 | 8,772,764 |
| 1968 | 66,732 | 8,740,765 |
| 1967 | 65,585 | 8,684,088 |
| 1966 | 64,507 | 8,613,651 |
| 1965 | 63,505 | 8,550,333 |
| 1964 | 62,587 | 8,510,429 |
| 1963 | 61,739 | 8,479,625 |
| 1962 | 60,948 | 8,448,233 |
| 1961 | 60,209 | 8,398,050 |
| 1960 | 59,372 | 8,331,725 |
Data sources: United Nations | World Population Prospects (2026–2100, retrieved 2026-07-08); World Bank | Health (1960–2025, retrieved 2026-07-08).
GeoRank.org/population/dominica/greece | CC BY 
From 2006 to 2016, the population of Dominica increased by 800 people (a 1.16% growth), while Greece lost 244,391 people (a 2.22% decline).
For the next 10 years, from 2016 to 2026, Dominica lost 4,105 people (a 5.9% decline), while Greece's population decreased by 404,396 people (a 3.75% decline).
Dominica was ranked 187th most populous country in 2006 and is 188th in 2026. Greece was ranked 74th in 2006 and ranked 94th now.
The UN's World Population Prospects forecasts that in 24 years (in 2050) Dominica's population will shrink by 3.7% to 63,075 people and will still be ranked 188th. The population of Greece will decrease by 10.9% to 9,242,128 people and rank change from 94th to 106th.
Both countries are in a period of decline and in 50 years are projected to lose 12.8% of the population in Dominica and 26.9% in Greece.
Population growth rate by year
| Year | Growth rate | |
|---|---|---|
|
Dominica
|
Greece
|
|
| 2100 | -0.78% | -0.65% |
| 2099 | -0.75% | -0.64% |
| 2098 | -0.69% | -0.64% |
| 2097 | -0.64% | -0.62% |
| 2096 | -0.68% | -0.61% |
| 2095 | -0.65% | -0.59% |
| 2094 | -0.63% | -0.57% |
| 2093 | -0.61% | -0.56% |
| 2092 | -0.62% | -0.54% |
| 2091 | -0.68% | -0.54% |
| 2090 | -0.62% | -0.55% |
| 2089 | -0.67% | -0.53% |
| 2088 | -0.62% | -0.52% |
| 2087 | -0.62% | -0.53% |
| 2086 | -0.61% | -0.54% |
| 2085 | -0.58% | -0.54% |
| 2084 | -0.58% | -0.53% |
| 2083 | -0.57% | -0.56% |
| 2082 | -0.53% | -0.57% |
| 2081 | -0.57% | -0.59% |
| 2080 | -0.58% | -0.61% |
| 2079 | -0.58% | -0.63% |
| 2078 | -0.52% | -0.66% |
| 2077 | -0.56% | -0.67% |
| 2076 | -0.55% | -0.69% |
| 2075 | -0.53% | -0.72% |
| 2074 | -0.54% | -0.75% |
| 2073 | -0.52% | -0.77% |
| 2072 | -0.5% | -0.78% |
| 2071 | -0.51% | -0.8% |
| 2070 | -0.44% | -0.83% |
| 2069 | -0.46% | -0.84% |
| 2068 | -0.43% | -0.84% |
| 2067 | -0.39% | -0.83% |
| 2066 | -0.42% | -0.82% |
| 2065 | -0.41% | -0.83% |
| 2064 | -0.35% | -0.83% |
| 2063 | -0.38% | -0.82% |
| 2062 | -0.37% | -0.82% |
| 2061 | -0.37% | -0.8% |
| 2060 | -0.33% | -0.8% |
| 2059 | -0.33% | -0.78% |
| 2058 | -0.33% | -0.77% |
| 2057 | -0.28% | -0.74% |
| 2056 | -0.29% | -0.72% |
| 2055 | -0.25% | -0.69% |
| 2054 | -0.24% | -0.66% |
| 2053 | -0.27% | -0.65% |
| 2052 | -0.22% | -0.63% |
| 2051 | -0.2% | -0.6% |
| 2050 | -0.16% | -0.59% |
| 2049 | -0.16% | -0.56% |
| 2048 | -0.13% | -0.55% |
| 2047 | -0.1% | -0.5% |
| 2046 | -0.07% | -0.49% |
| 2045 | -0.08% | -0.49% |
| 2044 | -0.09% | -0.47% |
| 2043 | -0.07% | -0.46% |
| 2042 | 0% | -0.47% |
| 2041 | 0.009% | -0.47% |
| 2040 | 0.009% | -0.46% |
| 2039 | 0.02% | -0.47% |
| 2038 | 0.03% | -0.47% |
| 2037 | -0.003% | -0.47% |
| 2036 | 0.005% | -0.48% |
| 2035 | -0.008% | -0.47% |
| 2034 | -0.03% | -0.47% |
| 2033 | -0.13% | -0.48% |
| 2032 | -0.25% | -0.46% |
| 2031 | -0.43% | -0.45% |
| 2030 | -0.51% | -0.45% |
| 2029 | -0.53% | -0.45% |
| 2028 | -0.54% | -0.44% |
| 2027 | -0.53% | -0.43% |
| 2026 | -0.56% | -0.41% |
| 2025 | -0.5% | 0.08% |
| 2024 | -0.46% | -0.02% |
| 2023 | -0.47% | -0.29% |
| 2022 | -0.56% | -1.25% |
| 2021 | -0.55% | -1.2% |
| 2020 | -0.45% | -0.21% |
| 2019 | -0.43% | -0.11% |
| 2018 | -0.47% | -0.2% |
| 2017 | -1.59% | -0.2% |
| 2016 | -1.14% | -0.42% |
| 2015 | 0.05% | -0.66% |
| 2014 | 0.94% | -0.66% |
| 2013 | 0.86% | -0.72% |
| 2012 | 0.09% | -0.54% |
| 2011 | 0.28% | -0.15% |
| 2010 | -0.007% | 0.13% |
| 2009 | 0.01% | 0.26% |
| 2008 | 0.01% | 0.27% |
| 2007 | 0.06% | 0.26% |
| 2006 | 0.1% | 0.3% |
| 2005 | 0.12% | 0.29% |
| 2004 | 0.17% | 0.25% |
| 2003 | 0.24% | 0.24% |
| 2002 | 0.12% | 0.37% |
| 2001 | -0.33% | 0.52% |
| 2000 | -0.52% | 0.41% |
| 1999 | -0.37% | 0.38% |
| 1998 | -0.25% | 0.56% |
| 1997 | -0.16% | 0.49% |
| 1996 | -0.08% | 0.44% |
| 1995 | -0.01% | 0.47% |
| 1994 | 0.06% | 0.5% |
| 1993 | 0.16% | 0.59% |
| 1992 | 0.04% | 0.77% |
| 1991 | -0.48% | 1.21% |
| 1990 | -0.75% | 1.06% |
| 1989 | -0.64% | 0.52% |
| 1988 | -0.58% | 0.36% |
| 1987 | -0.54% | 0.33% |
| 1986 | -0.47% | 0.33% |
| 1985 | -0.43% | 0.39% |
| 1984 | -0.43% | 0.5% |
| 1983 | -0.44% | 0.58% |
| 1982 | -0.41% | 0.62% |
| 1981 | -0.13% | 0.9% |
| 1980 | 0.17% | 0.99% |
| 1979 | 0.32% | 1.25% |
| 1978 | 0.44% | 1.31% |
| 1977 | 0.54% | 1.31% |
| 1976 | 0.62% | 1.57% |
| 1975 | 0.67% | 0.94% |
| 1974 | 0.72% | 0.37% |
| 1973 | 0.75% | 0.46% |
| 1972 | 0.76% | 0.65% |
| 1971 | 0.91% | 0.43% |
| 1970 | 1.43% | 0.23% |
| 1969 | 1.8% | 0.37% |
| 1968 | 1.75% | 0.65% |
| 1967 | 1.67% | 0.82% |
| 1966 | 1.58% | 0.74% |
| 1965 | 1.47% | 0.47% |
| 1964 | 1.37% | 0.36% |
| 1963 | 1.3% | 0.37% |
| 1962 | 1.23% | 0.6% |
| 1961 | 1.41% | 0.8% |
Data sources: United Nations | World Population Prospects (2026–2100, retrieved 2026-07-08); World Bank | Health (1961–2025, retrieved 2026-07-08).
GeoRank.org/population/dominica/greece | CC BY
In 2025, the population of Dominica declined by 0.5%, while Greece's population grew by 0.08%.
Live population counters
|
Dominica
|
Greece
|
|
|---|---|---|
| Current population |
65501
|
10371575
|
| Population rank | 188/197 | 94/197 |
| Percent of world population | 0.0008% | 0.12% |
| One net population change |
1.1 days
|
59.7 minutes
|
| One birth every |
12.1 hours
|
7.65 minutes
|
| One death every |
10.5 hours
|
4.17 minutes
|
| Daily growth/decline | -1 | +24 |
| Annual growth/decline | -334 | +8,828 |
| Annual growth/decline rate | -0.5% | +0.08% |
| Population growth rate rank | 185/197 | 154/197 |
| One migration net change every |
1.51 days
|
31.7 minutes
|
| Annual migration change | -242 | +16,636 |
| Net migration rank | 85/196 | 37/196 |
| Foreign-born residents | 8,440 | 1,423,964 |
| Foreign-born residents rank | 178/195 | 46/195 |
| Foreign-born share of population | 12.7% | 14.2% |
| Foreign-born share rank | 53/195 | 47/195 |
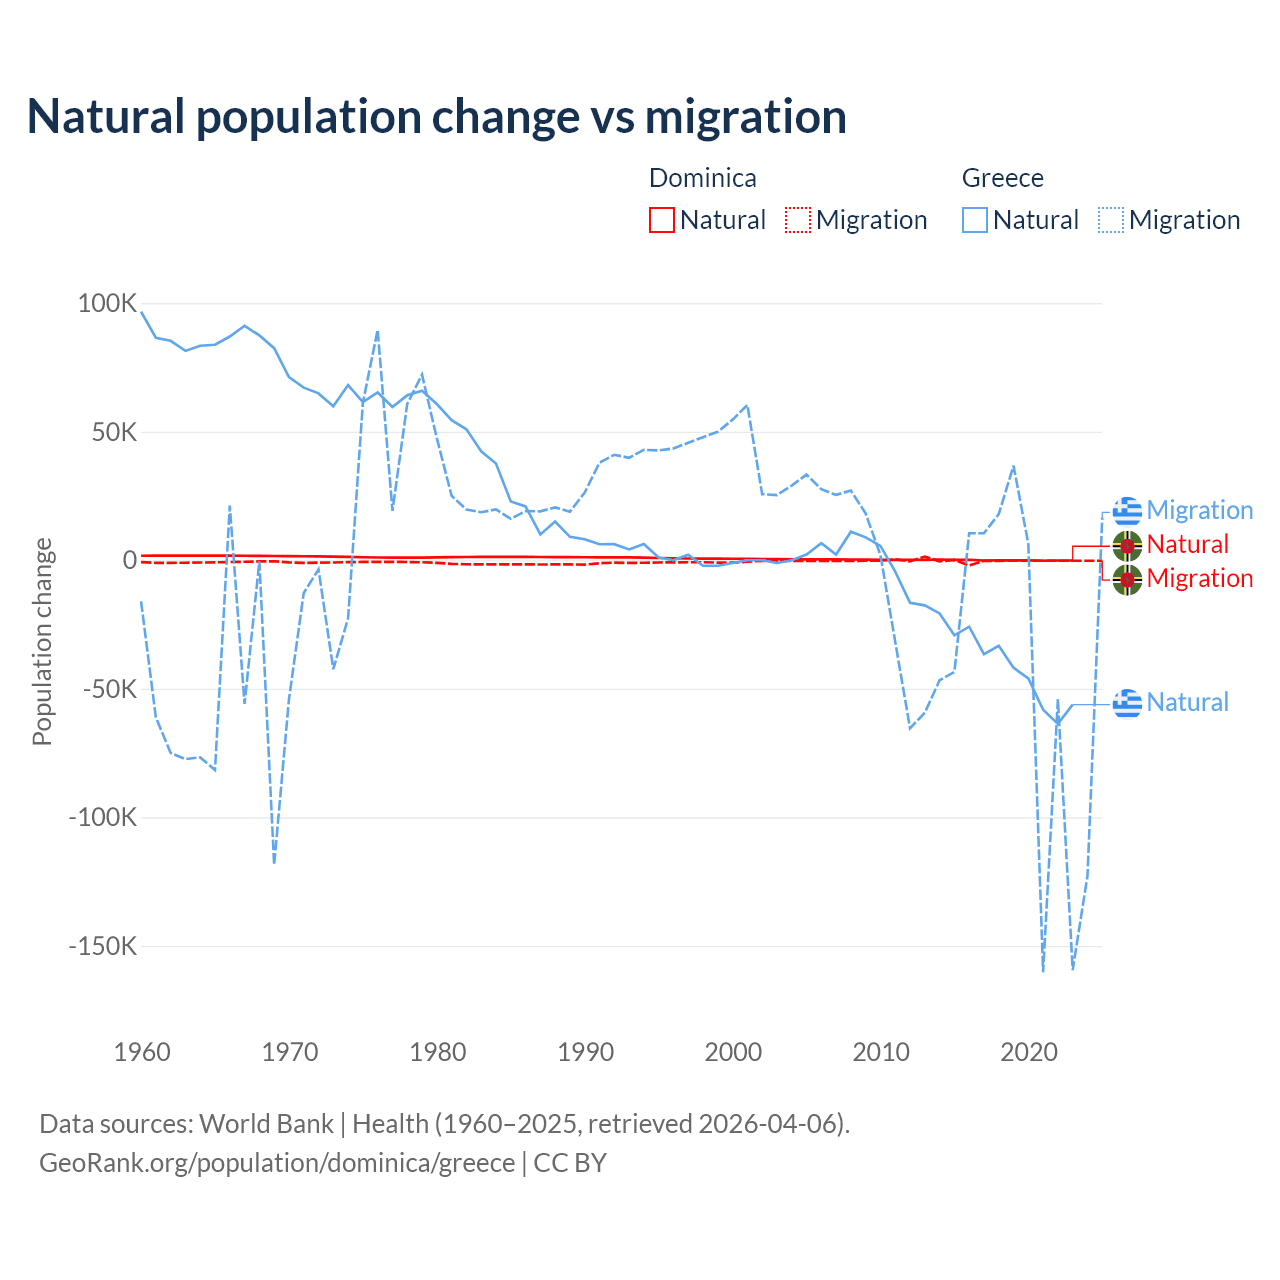
Natural population change vs migration
| Year | Population change | |||
|---|---|---|---|---|
|
Dominica
|
Greece
|
|||
| Natural | Migration | Natural | Migration | |
| 2025 | - | -242 | - | 16,636 |
| 2024 | -109 | -200 | -57,229 | -122,772 |
| 2023 | -111 | -199 | -56,200 | -159,430 |
| 2022 | -118 | -202 | -63,671 | -53,997 |
| 2021 | -205 | -224 | -58,135 | -160,277 |
| 2020 | -88 | -225 | -46,004 | 6,353 |
| 2019 | -75 | -228 | -41,814 | 36,762 |
| 2018 | -60 | -231 | -33,272 | 17,938 |
| 2017 | -124 | -234 | -36,566 | 10,483 |
| 2016 | 177 | -2,032 | -25,862 | 10,484 |
| 2015 | 157 | 92 | -29,216 | -43,462 |
| 2014 | 257 | -431 | -20,696 | -46,678 |
| 2013 | 110 | 1,376 | -17,545 | -59,323 |
| 2012 | 167 | -461 | -16,568 | -65,364 |
| 2011 | 121 | 307 | -4,441 | -31,786 |
| 2010 | 171 | -206 | 5,560 | 2,001 |
| 2009 | 220 | -198 | 8,886 | 18,182 |
| 2008 | 272 | -264 | 11,077 | 27,081 |
| 2007 | 319 | -297 | 2,210 | 25,400 |
| 2006 | 364 | -316 | 6,612 | 27,621 |
| 2005 | 339 | -259 | 2,197 | 33,297 |
| 2004 | 360 | -254 | 0 | 29,039 |
| 2003 | 387 | -252 | -1,093 | 25,323 |
| 2002 | 429 | -248 | 0 | 25,692 |
| 2001 | 556 | -585 | 0 | 60,387 |
| 2000 | 561 | -973 | -1,081 | 54,661 |
| 1999 | 647 | -947 | -2,153 | 49,930 |
| 1998 | 595 | -805 | -2,144 | 47,856 |
| 1997 | 662 | -803 | 2,133 | 45,671 |
| 1996 | 753 | -838 | 0 | 43,444 |
| 1995 | 853 | -885 | 1,056 | 42,674 |
| 1994 | 1,002 | -984 | 6,307 | 42,897 |
| 1993 | 1,130 | -1,061 | 4,185 | 39,829 |
| 1992 | 1,111 | -969 | 6,239 | 41,000 |
| 1991 | 1,103 | -1,183 | 6,192 | 37,917 |
| 1990 | 1,138 | -1,722 | 8,157 | 26,294 |
| 1989 | 1,178 | -1,651 | 9,080 | 18,862 |
| 1988 | 1,222 | -1,653 | 15,055 | 20,557 |
| 1987 | 1,256 | -1,661 | 10,001 | 19,005 |
| 1986 | 1,285 | -1,642 | 20,931 | 19,064 |
| 1985 | 1,302 | -1,617 | 22,849 | 16,093 |
| 1984 | 1,308 | -1,614 | 37,604 | 19,767 |
| 1983 | 1,301 | -1,615 | 42,341 | 18,655 |
| 1982 | 1,250 | -1,588 | 50,906 | 19,675 |
| 1981 | 1,169 | -1,420 | 54,484 | 25,061 |
| 1980 | 1,090 | -1,035 | 60,748 | 47,460 |
| 1979 | 981 | -802 | 65,882 | 72,184 |
| 1978 | 991 | -705 | 64,124 | 60,775 |
| 1977 | 996 | -634 | 59,574 | 19,193 |
| 1976 | 1,050 | -627 | 65,236 | 89,601 |
| 1975 | 1,142 | -678 | 61,516 | 61,265 |
| 1974 | 1,267 | -770 | 68,111 | -22,590 |
| 1973 | 1,400 | -882 | 59,824 | -42,387 |
| 1972 | 1,497 | -971 | 64,887 | -3,589 |
| 1971 | 1,549 | -1,022 | 67,116 | -12,747 |
| 1970 | 1,574 | -847 | 71,222 | -54,166 |
| 1969 | 1,628 | -406 | 82,464 | -118,544 |
| 1968 | 1,673 | -488 | 87,408 | -429 |
| 1967 | 1,716 | -605 | 91,183 | -55,853 |
| 1966 | 1,752 | -715 | 86,998 | 21,206 |
| 1965 | 1,778 | -816 | 83,793 | -81,576 |
| 1964 | 1,792 | -911 | 83,402 | -76,678 |
| 1963 | 1,796 | -978 | 81,404 | -77,345 |
| 1962 | 1,786 | -1,028 | 85,327 | -74,972 |
| 1961 | 1,762 | -1,044 | 86,500 | -61,102 |
| 1960 | 1,720 | -759 | 96,648 | -15,996 |
Data sources: World Bank | Health (1960–2025, retrieved 2026-07-08).
GeoRank.org/population/dominica/greece | CC BY
Over the last 10 years, 13.1% of the population change in Dominica is from natural causes (a loss of 556 people) and 86.9% is from migration (a loss of 3,683 people). In Greece 49.5% is from natural causes (a loss of 447,969 people) and 50.5% is from migration (a loss of 457,918 people).
As of 2024, 8,440 residents or 12.7% of the population were not native-born in Dominica, compared to 1,423,964 people or 14.2% in Greece.
Biggest cities by population
Compare countries by 7 more topics
Population differences between Dominica and Greece
|
Dominica
|
Greece
|
|
|---|---|---|
| Life expectancy | 71.6 years | 82.4 years |
| Average age | 38.4 years | 45.8 years |
| Median age | 37.3 years | 47.8 years |
| Male:Female ratio | 49.9:50.1 | 48.5:51.5 |
| Fertility rate | 1.48 births per woman | 1.24 births per woman |
| Population density | 226.2 ppl/mi² | 208.4 ppl/mi² |
Population map with other countries
Data sources: World Bank | Health (1960–2025, retrieved 2026-07-08); United Nations | World Population Prospects (1960–2026, retrieved 2026-07-08); U.S. Census Bureau (1960–2025, retrieved 2026-07-08); Central Intelligence Agency (CIA) (2000–2019, retrieved 2026-07-08).
GeoRank.org/population/dominica/greece | CC BY
Help us show the world through your eyes
Share a photo of your city and help others discover what it looks like to live there. Your contribution makes our data come alive.
Data sources:
- World Bank | Health (1960–2025, retrieved 2026-07-08)
- United Nations | World Population Prospects (1960–2100, retrieved 2026-07-08)
- U.S. Census Bureau (1960–2025, retrieved 2026-07-08)
- Central Intelligence Agency (CIA) (2000–2019, retrieved 2026-07-08)
- Wikidata (2026, retrieved 2026-07-08)
Creative Commons Attribution (CC BY) — you’re free to copy, share, remix, adapt, and use even commercially as long as you give appropriate credit and clearly indicate if you made changes. Other sources may be subject to different license terms.