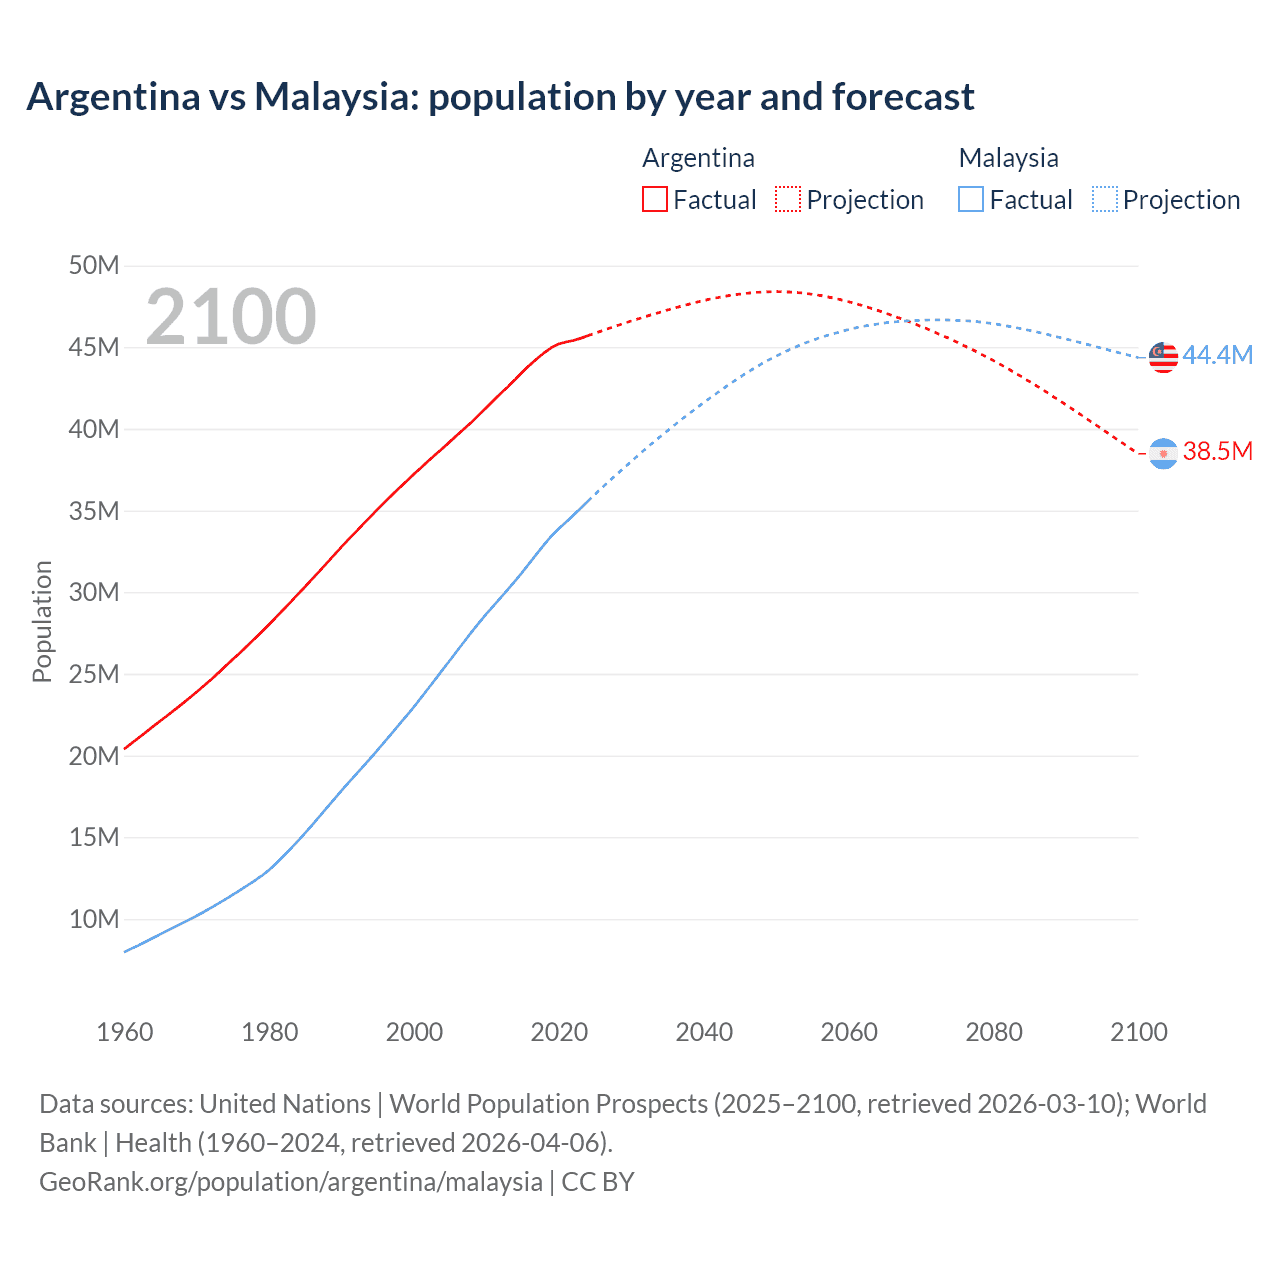
The latest officially reported population of Argentina was 45,851,378 in 2025 vs 35,977,838 people in Malaysia in 2025. In 2026, based on the adjusted UN estimation, the current Argentina's population is 46,083,022 people compared to 36,600,906 in Malaysia.
Population statistics:
- Argentina's population is 1.26 times bigger than Malaysia's.
- Argentina is ranked the 35th most populous country in the world, while Malaysia is the 45th.
- The countries together account for 1% of the world: 0.55% for Argentina vs 0.44% for Malaysia.
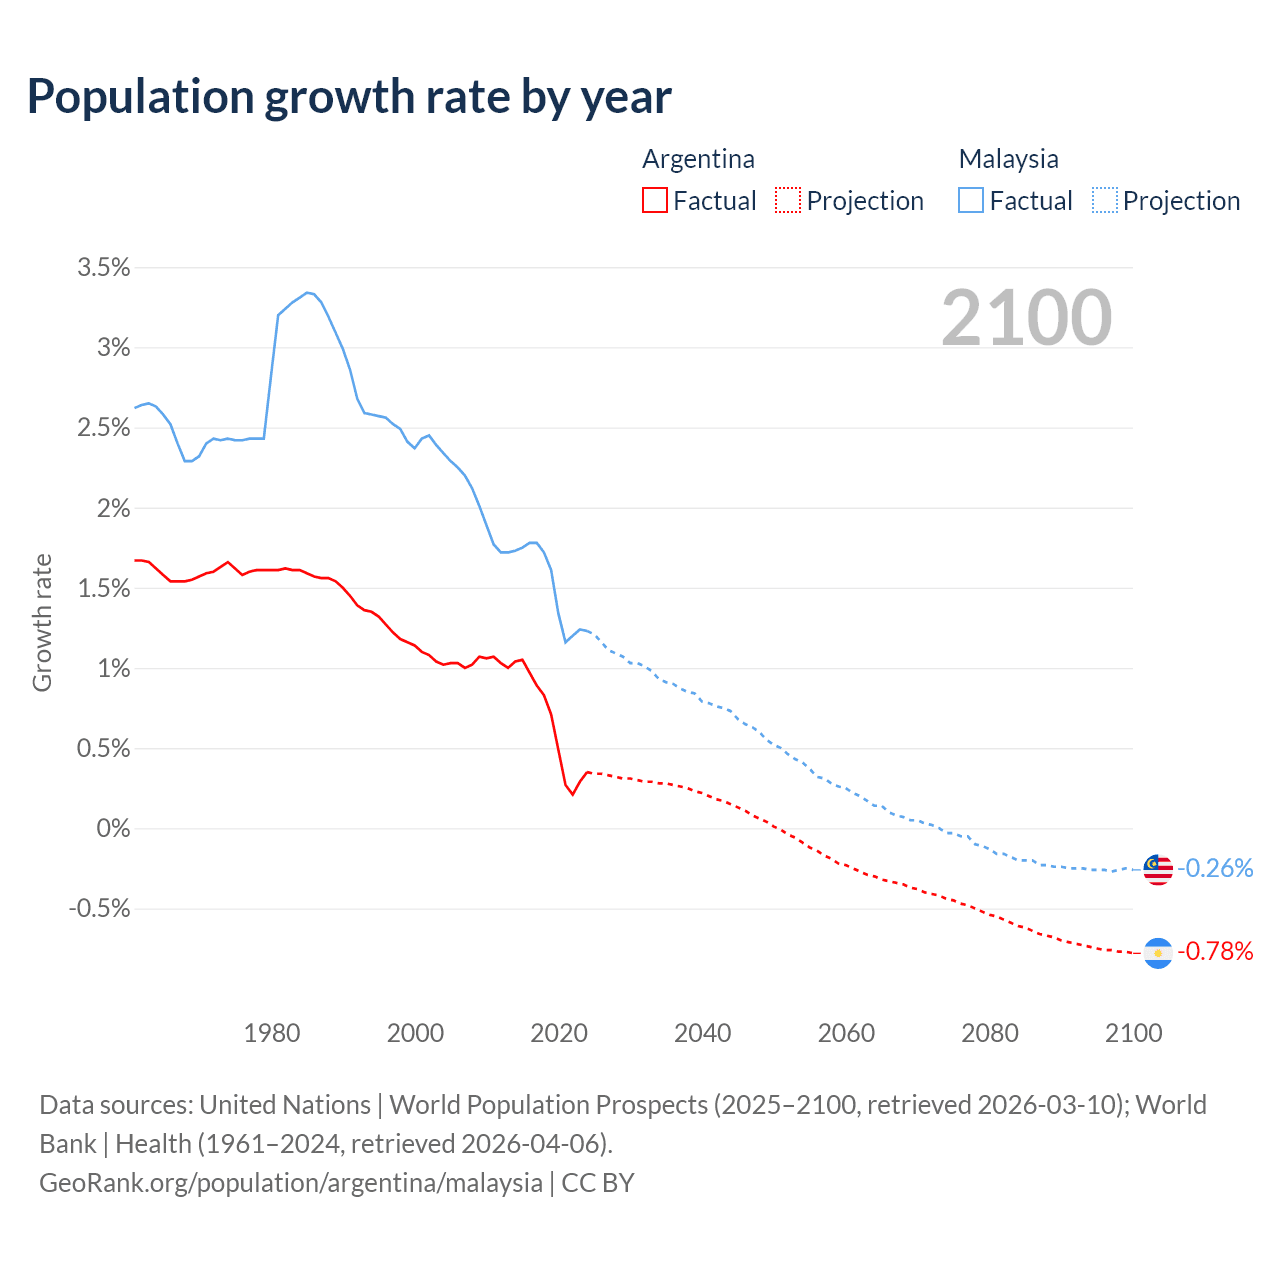
- For the last 10 years, Argentina has had an average growth rate of +0.58% per year vs +1.45% in Malaysia.
- Since 2006, the population of Argentina has increased from 39.6M people to 46.1M (16.3% growth), while Malaysia has grown from 26.4M to 36.6M (38.5% growth).
Argentina vs Malaysia: population by year and forecast
| Year | Population | |
|---|---|---|
 Argentina
|
 Malaysia
|
|
| 2100 | 38,470,262 | 44,342,183 |
| 2099 | 38,771,415 | 44,456,013 |
| 2098 | 39,073,080 | 44,568,480 |
| 2097 | 39,375,182 | 44,684,459 |
| 2096 | 39,677,541 | 44,803,334 |
| 2095 | 39,979,665 | 44,920,823 |
| 2094 | 40,280,721 | 45,035,868 |
| 2093 | 40,581,226 | 45,153,485 |
| 2092 | 40,880,268 | 45,267,003 |
| 2091 | 41,177,110 | 45,378,303 |
| 2090 | 41,471,465 | 45,489,767 |
| 2089 | 41,762,248 | 45,598,290 |
| 2088 | 42,049,176 | 45,706,098 |
| 2087 | 42,332,265 | 45,811,274 |
| 2086 | 42,611,405 | 45,914,874 |
| 2085 | 42,886,138 | 46,008,880 |
| 2084 | 43,155,291 | 46,099,604 |
| 2083 | 43,419,078 | 46,190,377 |
| 2082 | 43,676,752 | 46,272,999 |
| 2081 | 43,927,762 | 46,347,751 |
| 2080 | 44,172,331 | 46,423,514 |
| 2079 | 44,410,304 | 46,484,118 |
| 2078 | 44,641,934 | 46,537,169 |
| 2077 | 44,866,199 | 46,582,178 |
| 2076 | 45,084,796 | 46,607,029 |
| 2075 | 45,296,910 | 46,631,092 |
| 2074 | 45,503,622 | 46,646,324 |
| 2073 | 45,703,629 | 46,658,819 |
| 2072 | 45,897,528 | 46,658,396 |
| 2071 | 46,086,384 | 46,648,409 |
| 2070 | 46,269,334 | 46,633,600 |
| 2069 | 46,447,065 | 46,611,221 |
| 2068 | 46,618,955 | 46,588,049 |
| 2067 | 46,784,529 | 46,557,261 |
| 2066 | 46,944,689 | 46,518,384 |
| 2065 | 47,099,735 | 46,469,909 |
| 2064 | 47,248,960 | 46,405,405 |
| 2063 | 47,392,014 | 46,338,727 |
| 2062 | 47,528,548 | 46,260,178 |
| 2061 | 47,657,918 | 46,166,190 |
| 2060 | 47,779,392 | 46,064,001 |
| 2059 | 47,891,584 | 45,946,872 |
| 2058 | 47,994,829 | 45,825,593 |
| 2057 | 48,087,406 | 45,695,432 |
| 2056 | 48,168,616 | 45,554,612 |
| 2055 | 48,237,399 | 45,407,246 |
| 2054 | 48,293,593 | 45,241,331 |
| 2053 | 48,337,815 | 45,057,472 |
| 2052 | 48,368,984 | 44,862,361 |
| 2051 | 48,387,355 | 44,657,253 |
| 2050 | 48,392,715 | 44,434,221 |
| 2049 | 48,386,015 | 44,206,196 |
| 2048 | 48,368,178 | 43,963,591 |
| 2047 | 48,338,867 | 43,701,058 |
| 2046 | 48,298,433 | 43,427,087 |
| 2045 | 48,247,039 | 43,146,785 |
| 2044 | 48,185,620 | 42,855,667 |
| 2043 | 48,114,882 | 42,546,972 |
| 2042 | 48,035,259 | 42,229,093 |
| 2041 | 47,946,583 | 41,911,573 |
| 2040 | 47,849,241 | 41,587,509 |
| 2039 | 47,744,601 | 41,260,315 |
| 2038 | 47,632,807 | 40,918,517 |
| 2037 | 47,515,667 | 40,574,312 |
| 2036 | 47,394,113 | 40,223,758 |
| 2035 | 47,268,510 | 39,866,097 |
| 2034 | 47,138,768 | 39,505,672 |
| 2033 | 47,006,032 | 39,141,994 |
| 2032 | 46,871,040 | 38,762,420 |
| 2031 | 46,733,292 | 38,376,399 |
| 2030 | 46,593,148 | 37,985,824 |
| 2029 | 46,450,303 | 37,597,060 |
| 2028 | 46,305,029 | 37,198,261 |
| 2027 | 46,156,602 | 36,797,098 |
| 2026 | 46,005,310 | 36,393,693 |
| 2025 | 45,851,378 | 35,977,838 |
| 2024 | 45,696,159 | 35,557,673 |
| 2023 | 45,538,401 | 35,126,298 |
| 2022 | 45,407,904 | 34,695,493 |
| 2021 | 45,312,281 | 34,282,399 |
| 2020 | 45,191,965 | 33,889,558 |
| 2019 | 44,973,465 | 33,440,596 |
| 2018 | 44,654,882 | 32,910,967 |
| 2017 | 44,288,894 | 32,355,644 |
| 2016 | 43,900,313 | 31,789,685 |
| 2015 | 43,477,012 | 31,232,798 |
| 2014 | 43,024,071 | 30,696,137 |
| 2013 | 42,582,455 | 30,174,265 |
| 2012 | 42,161,721 | 29,662,831 |
| 2011 | 41,730,660 | 29,162,039 |
| 2010 | 41,288,694 | 28,655,776 |
| 2009 | 40,854,831 | 28,124,778 |
| 2008 | 40,424,148 | 27,570,059 |
| 2007 | 40,016,763 | 26,998,389 |
| 2006 | 39,622,115 | 26,417,909 |
| 2005 | 39,216,789 | 25,836,071 |
| 2004 | 38,815,916 | 25,256,772 |
| 2003 | 38,424,282 | 24,679,602 |
| 2002 | 38,029,349 | 24,102,477 |
| 2001 | 37,624,825 | 23,526,538 |
| 2000 | 37,213,984 | 22,967,816 |
| 1999 | 36,794,682 | 22,435,531 |
| 1998 | 36,372,860 | 21,906,713 |
| 1997 | 35,947,791 | 21,375,218 |
| 1996 | 35,513,793 | 20,850,087 |
| 1995 | 35,070,020 | 20,330,599 |
| 1994 | 34,613,491 | 19,820,446 |
| 1993 | 34,152,717 | 19,322,664 |
| 1992 | 33,693,527 | 18,834,572 |
| 1991 | 33,230,294 | 18,342,464 |
| 1990 | 32,755,901 | 17,833,171 |
| 1989 | 32,270,948 | 17,314,997 |
| 1988 | 31,780,532 | 16,796,605 |
| 1987 | 31,291,762 | 16,276,737 |
| 1986 | 30,811,980 | 15,760,419 |
| 1985 | 30,336,441 | 15,252,258 |
| 1984 | 29,863,093 | 14,759,009 |
| 1983 | 29,391,332 | 14,285,907 |
| 1982 | 28,924,262 | 13,832,798 |
| 1981 | 28,463,959 | 13,399,203 |
| 1980 | 28,011,596 | 12,983,363 |
| 1979 | 27,568,895 | 12,627,862 |
| 1978 | 27,132,158 | 12,328,157 |
| 1977 | 26,701,805 | 12,035,713 |
| 1976 | 26,282,283 | 11,750,097 |
| 1975 | 25,874,107 | 11,471,914 |
| 1974 | 25,461,351 | 11,200,906 |
| 1973 | 25,046,005 | 10,935,621 |
| 1972 | 24,644,328 | 10,676,835 |
| 1971 | 24,257,208 | 10,423,453 |
| 1970 | 23,878,327 | 10,178,802 |
| 1969 | 23,508,711 | 9,947,597 |
| 1968 | 23,150,583 | 9,725,281 |
| 1967 | 22,799,059 | 9,507,099 |
| 1966 | 22,453,893 | 9,284,688 |
| 1965 | 22,112,629 | 9,056,408 |
| 1964 | 21,769,453 | 8,828,406 |
| 1963 | 21,421,705 | 8,602,160 |
| 1962 | 21,072,538 | 8,380,172 |
| 1961 | 20,726,276 | 8,164,443 |
| 1960 | 20,386,045 | 7,956,197 |
Data sources: United Nations | World Population Prospects (2026–2100, retrieved 2026-07-08); World Bank | Health (1960–2025, retrieved 2026-07-08).
GeoRank.org/population/argentina/malaysia | CC BY 
From 2006 to 2016, the population of Argentina increased by 4,278,198 people (a 10.8% growth), while Malaysia gained 5,371,776 people (a 20.3% growth).
For the next 10 years, from 2016 to 2026, Argentina gained 2,182,709 people (a 4.97% growth), while Malaysia's population increased by 4,811,221 people (a 15.1% growth).
Argentina was ranked 31st most populous country in 2006 and is 35th in 2026. Malaysia was ranked 44th in 2006 and ranked 45th now.
The UN's World Population Prospects forecasts that in 24 years (in 2050) Argentina's population will grow by 5.01% to 48,392,715 people with a rank change from 35th to 44th. The population of Malaysia will increase by 21.4% to 44,434,221 people and rank change from 45th to 49th.
Argentina is projected to reach its peak in 2050 at 48.4M people compared to the peak of 46.7M people in 2073 for Malaysia.
Population growth rate by year
| Year | Growth rate | |
|---|---|---|
|
Argentina
|
Malaysia
|
|
| 2100 | -0.78% | -0.26% |
| 2099 | -0.77% | -0.25% |
| 2098 | -0.77% | -0.26% |
| 2097 | -0.76% | -0.27% |
| 2096 | -0.76% | -0.26% |
| 2095 | -0.75% | -0.26% |
| 2094 | -0.74% | -0.26% |
| 2093 | -0.73% | -0.25% |
| 2092 | -0.72% | -0.25% |
| 2091 | -0.71% | -0.25% |
| 2090 | -0.7% | -0.24% |
| 2089 | -0.68% | -0.24% |
| 2088 | -0.67% | -0.23% |
| 2087 | -0.66% | -0.23% |
| 2086 | -0.64% | -0.2% |
| 2085 | -0.62% | -0.2% |
| 2084 | -0.61% | -0.2% |
| 2083 | -0.59% | -0.18% |
| 2082 | -0.57% | -0.16% |
| 2081 | -0.55% | -0.16% |
| 2080 | -0.54% | -0.13% |
| 2079 | -0.52% | -0.11% |
| 2078 | -0.5% | -0.1% |
| 2077 | -0.48% | -0.05% |
| 2076 | -0.47% | -0.05% |
| 2075 | -0.45% | -0.03% |
| 2074 | -0.44% | -0.03% |
| 2073 | -0.42% | 0.001% |
| 2072 | -0.41% | 0.02% |
| 2071 | -0.4% | 0.03% |
| 2070 | -0.38% | 0.05% |
| 2069 | -0.37% | 0.05% |
| 2068 | -0.35% | 0.07% |
| 2067 | -0.34% | 0.08% |
| 2066 | -0.33% | 0.1% |
| 2065 | -0.32% | 0.14% |
| 2064 | -0.3% | 0.14% |
| 2063 | -0.29% | 0.17% |
| 2062 | -0.27% | 0.2% |
| 2061 | -0.25% | 0.22% |
| 2060 | -0.23% | 0.25% |
| 2059 | -0.22% | 0.26% |
| 2058 | -0.19% | 0.28% |
| 2057 | -0.17% | 0.31% |
| 2056 | -0.14% | 0.32% |
| 2055 | -0.12% | 0.37% |
| 2054 | -0.09% | 0.41% |
| 2053 | -0.06% | 0.43% |
| 2052 | -0.04% | 0.46% |
| 2051 | -0.01% | 0.5% |
| 2050 | 0.01% | 0.52% |
| 2049 | 0.04% | 0.55% |
| 2048 | 0.06% | 0.6% |
| 2047 | 0.08% | 0.63% |
| 2046 | 0.11% | 0.65% |
| 2045 | 0.13% | 0.68% |
| 2044 | 0.15% | 0.73% |
| 2043 | 0.17% | 0.75% |
| 2042 | 0.18% | 0.76% |
| 2041 | 0.2% | 0.78% |
| 2040 | 0.22% | 0.79% |
| 2039 | 0.23% | 0.84% |
| 2038 | 0.25% | 0.85% |
| 2037 | 0.26% | 0.87% |
| 2036 | 0.27% | 0.9% |
| 2035 | 0.28% | 0.91% |
| 2034 | 0.28% | 0.93% |
| 2033 | 0.29% | 0.98% |
| 2032 | 0.29% | 1.01% |
| 2031 | 0.3% | 1.03% |
| 2030 | 0.31% | 1.03% |
| 2029 | 0.31% | 1.07% |
| 2028 | 0.32% | 1.09% |
| 2027 | 0.33% | 1.11% |
| 2026 | 0.34% | 1.16% |
| 2025 | 0.34% | 1.18% |
| 2024 | 0.35% | 1.23% |
| 2023 | 0.29% | 1.24% |
| 2022 | 0.21% | 1.2% |
| 2021 | 0.27% | 1.16% |
| 2020 | 0.49% | 1.34% |
| 2019 | 0.71% | 1.61% |
| 2018 | 0.83% | 1.72% |
| 2017 | 0.89% | 1.78% |
| 2016 | 0.97% | 1.78% |
| 2015 | 1.05% | 1.75% |
| 2014 | 1.04% | 1.73% |
| 2013 | 1% | 1.72% |
| 2012 | 1.03% | 1.72% |
| 2011 | 1.07% | 1.77% |
| 2010 | 1.06% | 1.89% |
| 2009 | 1.07% | 2.01% |
| 2008 | 1.02% | 2.12% |
| 2007 | 1% | 2.2% |
| 2006 | 1.03% | 2.25% |
| 2005 | 1.03% | 2.29% |
| 2004 | 1.02% | 2.34% |
| 2003 | 1.04% | 2.39% |
| 2002 | 1.08% | 2.45% |
| 2001 | 1.1% | 2.43% |
| 2000 | 1.14% | 2.37% |
| 1999 | 1.16% | 2.41% |
| 1998 | 1.18% | 2.49% |
| 1997 | 1.22% | 2.52% |
| 1996 | 1.27% | 2.56% |
| 1995 | 1.32% | 2.57% |
| 1994 | 1.35% | 2.58% |
| 1993 | 1.36% | 2.59% |
| 1992 | 1.39% | 2.68% |
| 1991 | 1.45% | 2.86% |
| 1990 | 1.5% | 2.99% |
| 1989 | 1.54% | 3.09% |
| 1988 | 1.56% | 3.19% |
| 1987 | 1.56% | 3.28% |
| 1986 | 1.57% | 3.33% |
| 1985 | 1.59% | 3.34% |
| 1984 | 1.61% | 3.31% |
| 1983 | 1.61% | 3.28% |
| 1982 | 1.62% | 3.24% |
| 1981 | 1.61% | 3.2% |
| 1980 | 1.61% | 2.82% |
| 1979 | 1.61% | 2.43% |
| 1978 | 1.61% | 2.43% |
| 1977 | 1.6% | 2.43% |
| 1976 | 1.58% | 2.42% |
| 1975 | 1.62% | 2.42% |
| 1974 | 1.66% | 2.43% |
| 1973 | 1.63% | 2.42% |
| 1972 | 1.6% | 2.43% |
| 1971 | 1.59% | 2.4% |
| 1970 | 1.57% | 2.32% |
| 1969 | 1.55% | 2.29% |
| 1968 | 1.54% | 2.29% |
| 1967 | 1.54% | 2.4% |
| 1966 | 1.54% | 2.52% |
| 1965 | 1.58% | 2.58% |
| 1964 | 1.62% | 2.63% |
| 1963 | 1.66% | 2.65% |
| 1962 | 1.67% | 2.64% |
| 1961 | 1.67% | 2.62% |
Data sources: United Nations | World Population Prospects (2026–2100, retrieved 2026-07-08); World Bank | Health (1961–2025, retrieved 2026-07-08).
GeoRank.org/population/argentina/malaysia | CC BY
In 2025, the population of Argentina grew by 0.34%, while Malaysia's population grew by 1.18%.
Live population counters
|
Argentina
|
Malaysia
|
|
|---|---|---|
| Current population |
46083022
|
36600906
|
| Population rank | 35/197 | 45/197 |
| Percent of world population | 0.55% | 0.44% |
| One net population change |
3.4 minutes
|
1.25 minutes
|
| One birth every |
1.04 minutes
|
1.2 minutes
|
| One death every |
1.49 minutes
|
2.8 minutes
|
| Daily growth/decline | +425 | +1,151 |
| Annual growth/decline | +155,219 | +420,165 |
| Annual growth/decline rate | +0.34% | +1.18% |
| Population growth rate rank | 143/197 | 89/197 |
| One migration net change every |
3.07 hours
|
3.16 minutes
|
| Annual migration change | +2,859 | +166,615 |
| Net migration rank | 54/196 | 7/196 |
| Foreign-born residents | 1,958,039 | 3,806,514 |
| Foreign-born residents rank | 38/195 | 18/195 |
| Foreign-born share of population | 4.3% | 10.7% |
| Foreign-born share rank | 102/195 | 62/195 |
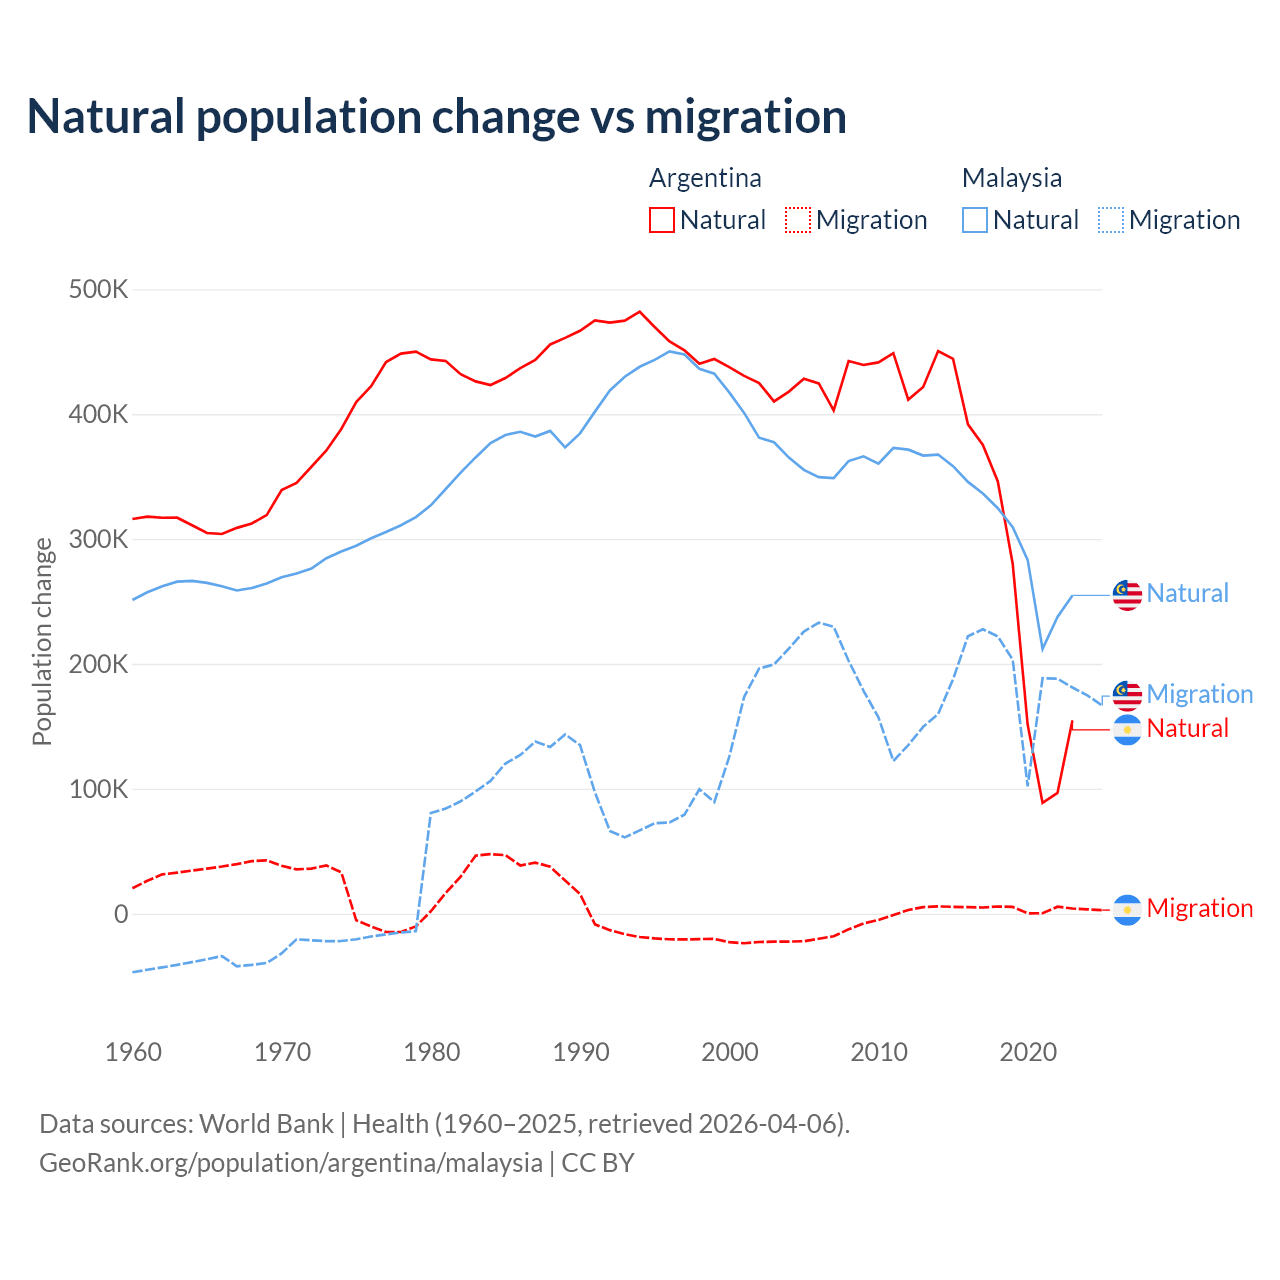
Natural population change vs migration
| Year | Population change | |||
|---|---|---|---|---|
|
Argentina
|
Malaysia
|
|||
| Natural | Migration | Natural | Migration | |
| 2025 | - | 2,859 | - | 166,615 |
| 2024 | 153,265 | 3,454 | 252,068 | 174,770 |
| 2023 | 154,648 | 4,133 | 254,806 | 181,071 |
| 2022 | 96,673 | 5,589 | 237,560 | 188,154 |
| 2021 | 88,677 | 314 | 212,002 | 188,506 |
| 2020 | 151,347 | 292 | 283,282 | 101,907 |
| 2019 | 280,005 | 5,397 | 309,426 | 203,284 |
| 2018 | 346,031 | 5,742 | 324,568 | 221,965 |
| 2017 | 375,260 | 4,931 | 336,434 | 227,677 |
| 2016 | 391,767 | 5,215 | 345,681 | 222,141 |
| 2015 | 444,161 | 5,464 | 358,302 | 187,663 |
| 2014 | 450,462 | 5,794 | 367,587 | 159,791 |
| 2013 | 421,694 | 5,275 | 366,738 | 149,637 |
| 2012 | 411,540 | 2,978 | 371,497 | 134,975 |
| 2011 | 448,730 | -1,117 | 372,836 | 122,269 |
| 2010 | 441,335 | -5,003 | 360,260 | 157,164 |
| 2009 | 439,271 | -7,882 | 366,157 | 178,410 |
| 2008 | 442,442 | -12,517 | 362,380 | 202,481 |
| 2007 | 402,889 | -18,099 | 348,711 | 229,784 |
| 2006 | 424,591 | -20,109 | 349,509 | 232,971 |
| 2005 | 428,247 | -22,068 | 355,324 | 225,864 |
| 2004 | 417,970 | -22,381 | 365,138 | 212,278 |
| 2003 | 410,141 | -22,450 | 377,425 | 199,510 |
| 2002 | 424,825 | -22,674 | 381,084 | 196,227 |
| 2001 | 430,579 | -23,687 | 400,939 | 173,613 |
| 2000 | 437,562 | -22,775 | 417,371 | 125,499 |
| 1999 | 444,038 | -20,220 | 432,355 | 89,335 |
| 1998 | 440,184 | -20,326 | 436,316 | 99,639 |
| 1997 | 450,930 | -20,651 | 447,768 | 79,266 |
| 1996 | 458,199 | -20,486 | 450,174 | 73,040 |
| 1995 | 469,658 | -19,815 | 443,349 | 72,393 |
| 1994 | 481,958 | -18,723 | 437,873 | 66,685 |
| 1993 | 474,791 | -16,455 | 429,910 | 61,079 |
| 1992 | 473,226 | -13,201 | 418,900 | 66,286 |
| 1991 | 474,960 | -8,537 | 401,938 | 97,111 |
| 1990 | 466,640 | 15,719 | 384,518 | 135,020 |
| 1989 | 460,991 | 26,555 | 373,277 | 143,544 |
| 1988 | 455,701 | 37,594 | 386,507 | 133,478 |
| 1987 | 443,404 | 40,859 | 381,999 | 137,759 |
| 1986 | 436,760 | 38,586 | 385,799 | 127,081 |
| 1985 | 428,866 | 46,889 | 383,243 | 120,215 |
| 1984 | 423,279 | 47,659 | 376,797 | 106,248 |
| 1983 | 426,145 | 46,438 | 365,290 | 97,862 |
| 1982 | 431,926 | 29,616 | 353,138 | 89,942 |
| 1981 | 442,501 | 16,569 | 339,991 | 84,142 |
| 1980 | 443,732 | 1,932 | 326,947 | 80,617 |
| 1979 | 449,952 | -10,213 | 317,439 | -13,980 |
| 1978 | 448,413 | -14,665 | 311,027 | -15,059 |
| 1977 | 441,647 | -14,675 | 305,515 | -16,601 |
| 1976 | 422,330 | -10,235 | 300,615 | -18,316 |
| 1975 | 409,561 | -5,293 | 294,541 | -20,480 |
| 1974 | 388,107 | 33,134 | 289,880 | -21,919 |
| 1973 | 370,856 | 38,589 | 284,611 | -21,995 |
| 1972 | 357,835 | 36,050 | 276,263 | -21,305 |
| 1971 | 344,889 | 35,442 | 272,323 | -20,535 |
| 1970 | 339,096 | 38,355 | 269,341 | -31,839 |
| 1969 | 319,108 | 42,688 | 264,327 | -39,420 |
| 1968 | 312,440 | 42,014 | 260,705 | -40,996 |
| 1967 | 308,904 | 39,711 | 258,764 | -42,108 |
| 1966 | 303,981 | 37,752 | 262,162 | -33,993 |
| 1965 | 304,734 | 36,083 | 264,836 | -36,456 |
| 1964 | 311,020 | 34,530 | 266,406 | -38,785 |
| 1963 | 317,041 | 32,866 | 265,815 | -40,952 |
| 1962 | 316,952 | 31,449 | 262,140 | -43,033 |
| 1961 | 317,816 | 26,322 | 257,270 | -44,916 |
| 1960 | 315,943 | 20,387 | 251,090 | -46,948 |
Data sources: World Bank | Health (1960–2025, retrieved 2026-07-08).
GeoRank.org/population/argentina/malaysia | CC BY
Over the last 10 years, 98.4% of the population change in Argentina is from natural causes (a gain of 2,481,834 people) and 1.61% is from migration (a gain of 40,531 people). In Malaysia 60.6% is from natural causes (a gain of 2,914,129 people) and 39.4% is from migration (a gain of 1,897,138 people).
As of 2024, 1,958,039 residents or 4.3% of the population were not native-born in Argentina, compared to 3,806,514 people or 10.7% in Malaysia.
Biggest cities by population
|
Argentina
|
|
|---|---|
| City | Population |
| Buenos Aires | 3.12M |
| Cordoba | 1.51M |
| Rosario | 1.04M |
| San Miguel de Tucuman | 602K |
| Salta | 595K |
| Mar del Plata | 593K |
| San Juan | 471K |
| Lanus | 459K |
| Corrientes | 430K |
| Santa Fe | 409K |
|
Malaysia
|
|
|---|---|
| City | Population |
| Kuala Lumpur | 9M |
| Klang | 878K |
| Ipoh | 867K |
| Johor Bahru | 798K |
| George Town | 794K |
| Shah Alam | 741K |
| Subang Jaya | 708K |
| Petaling Jaya | 639K |
| Kuantan | 608K |
| Sungai Petani | 545K |
Compare countries by 7 more topics
Population differences between Argentina and Malaysia
|
Argentina
|
Malaysia
|
|
|---|---|---|
| Life expectancy | 77.8 years | 77.2 years |
| Average age | 36.1 years | 33.6 years |
| Median age | 33.9 years | 31.9 years |
| Male:Female ratio | 49.6:50.4 | 52.3:47.7 |
| Fertility rate | 1.5 births per woman | 1.54 births per woman |
| Population density | 43.5 ppl/mi² | 286.9 ppl/mi² |
Population map with other countries
Data sources: World Bank | Health (1960–2025, retrieved 2026-07-08); United Nations | World Population Prospects (1960–2026, retrieved 2026-07-08); U.S. Census Bureau (1960–2025, retrieved 2026-07-08); Central Intelligence Agency (CIA) (2000–2019, retrieved 2026-07-08).
GeoRank.org/population/argentina/malaysia | CC BY
Help us show the world through your eyes
Share a photo of your city and help others discover what it looks like to live there. Your contribution makes our data come alive.
Data sources:
- World Bank | Health (1960–2025, retrieved 2026-07-08)
- United Nations | World Population Prospects (1960–2100, retrieved 2026-07-08)
- U.S. Census Bureau (1960–2025, retrieved 2026-07-08)
- Wikidata (2026, retrieved 2026-07-08)
- Central Intelligence Agency (CIA) (2000–2019, retrieved 2026-07-08)
Creative Commons Attribution (CC BY) — you’re free to copy, share, remix, adapt, and use even commercially as long as you give appropriate credit and clearly indicate if you made changes. Other sources may be subject to different license terms.