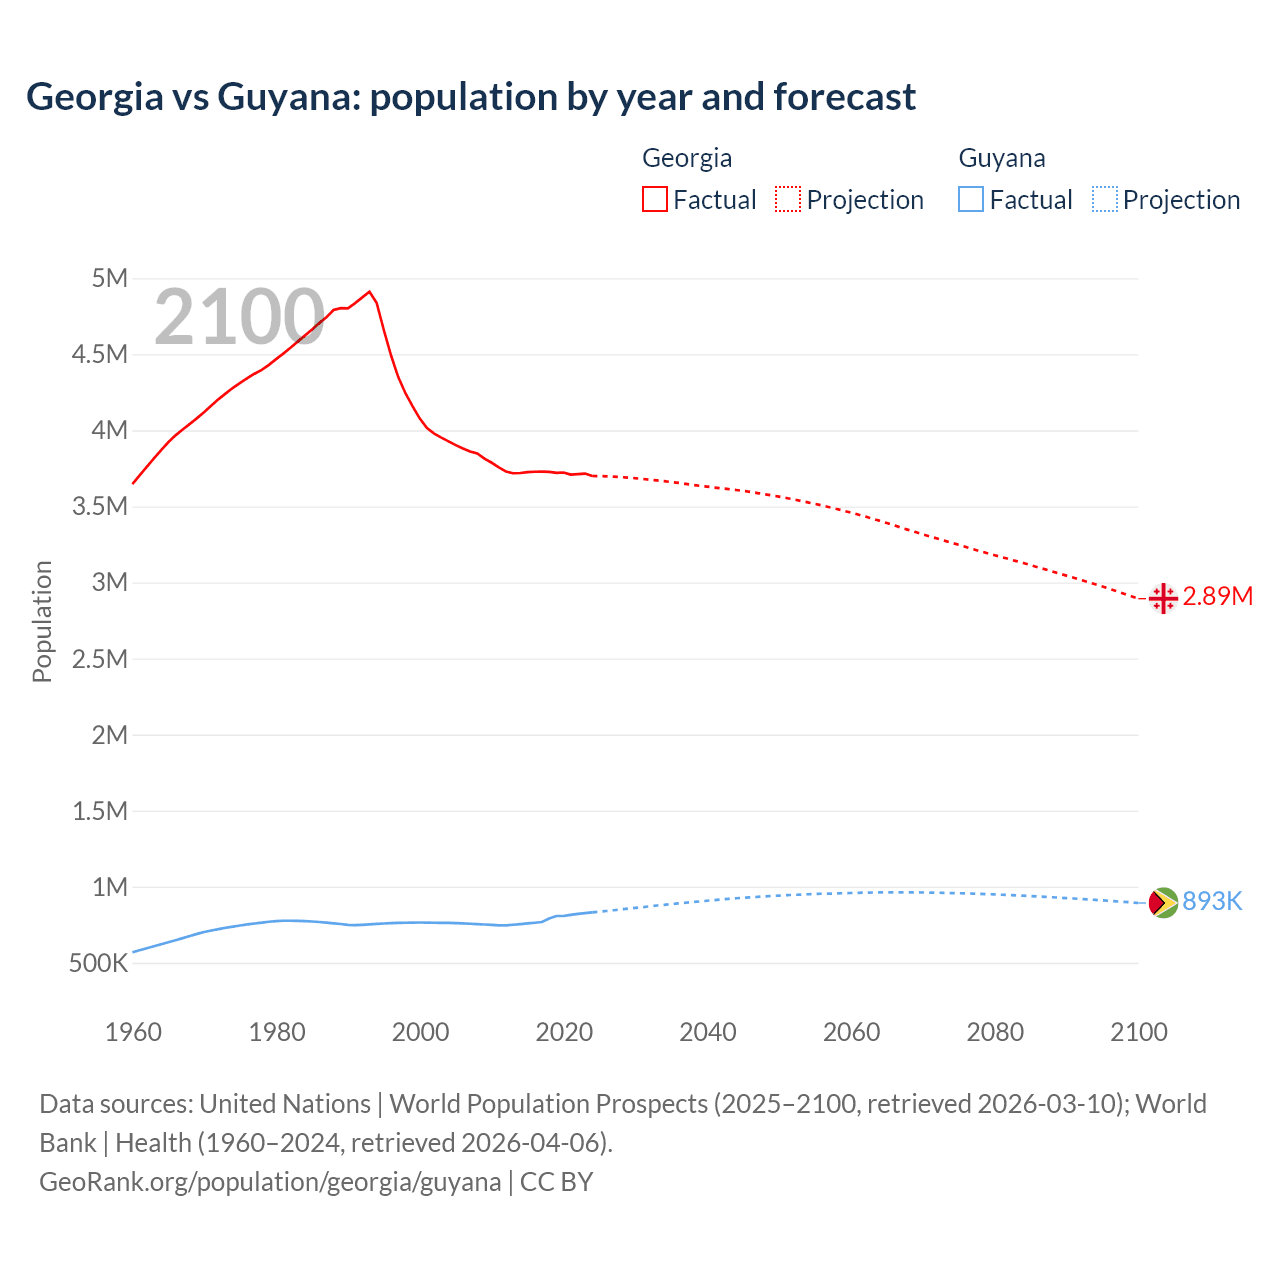
The latest officially reported population of Georgia was 3,935,766 in 2025 vs 835,986 people in Guyana in 2025. In 2026, based on the adjusted UN estimation, the current Georgia's population is 3,934,050 people compared to 843,423 in Guyana.
Population statistics:
- Georgia's population is 4.66 times bigger than Guyana's.
- Georgia is ranked the 129th most populous country in the world, while Guyana is the 162nd.
- The countries together account for 0.06% of the world: 0.05% for Georgia vs 0.01% for Guyana.
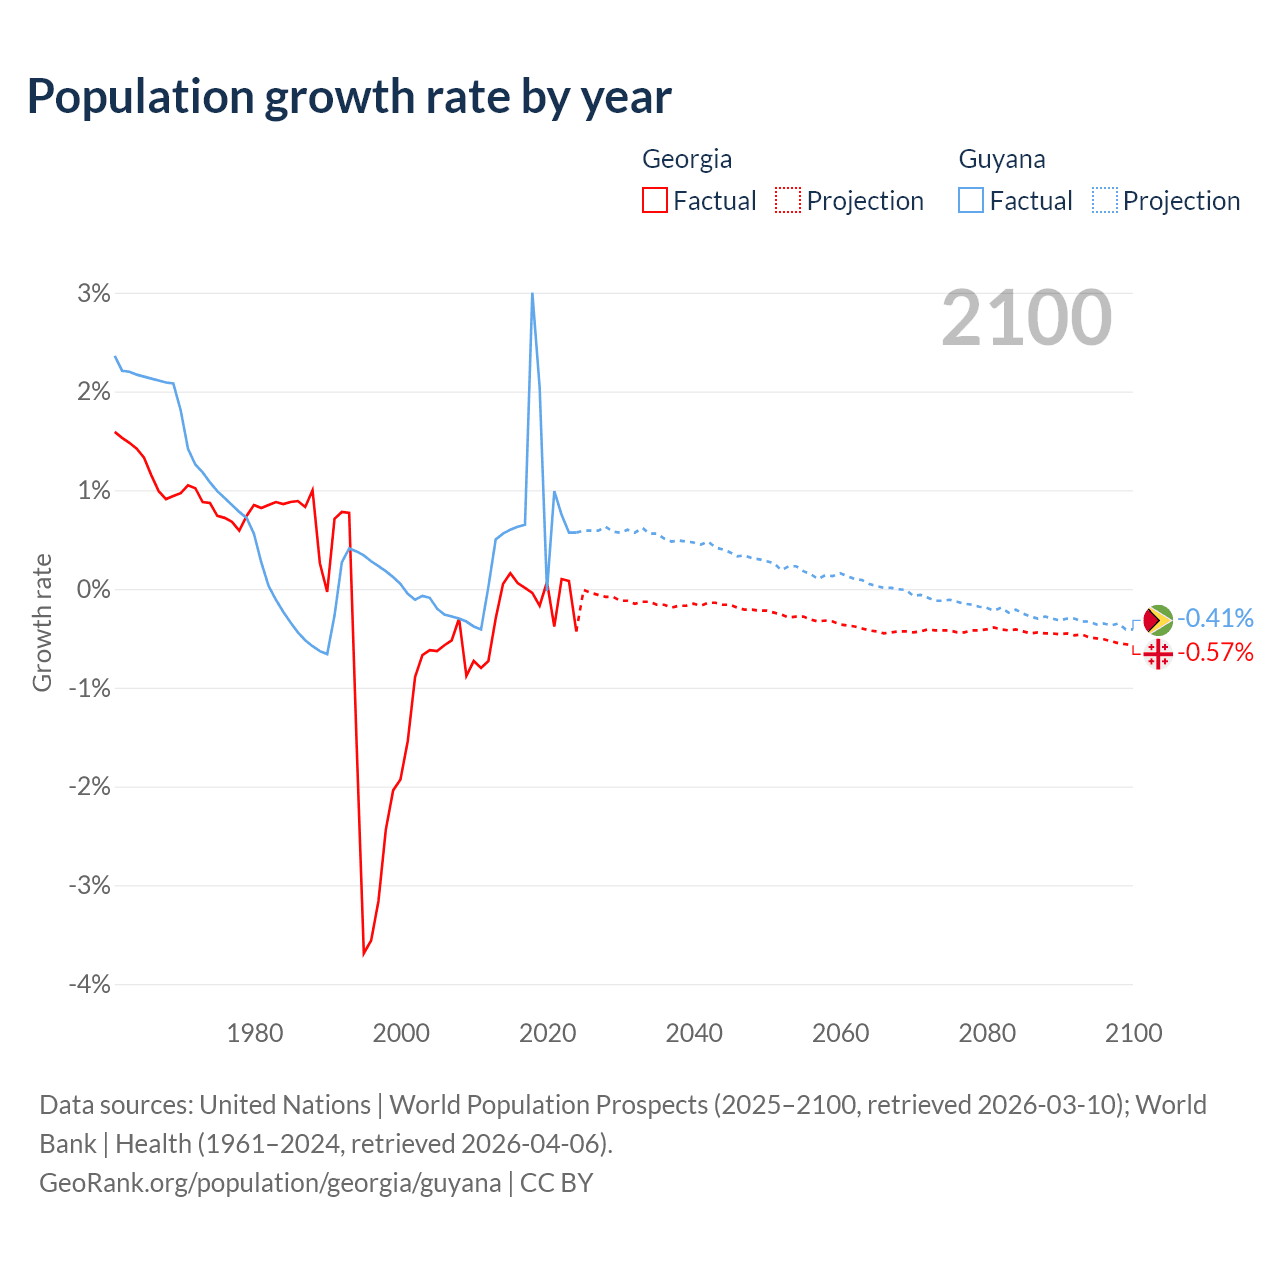
- For the last 10 years, Georgia has had an average growth rate of +0.52% per year vs +0.94% in Guyana.
- Since 2006, the population of Georgia has increased from 3.88M people to 3.93M (1.38% growth), while Guyana has grown from 759K to 843K (11.1% growth).
Georgia vs Guyana: population by year and forecast
| Year | Population | |
|---|---|---|
 Georgia
|
 Guyana
|
|
| 2100 | 3,078,390 | 893,400 |
| 2099 | 3,095,962 | 897,049 |
| 2098 | 3,113,268 | 900,704 |
| 2097 | 3,130,535 | 903,852 |
| 2096 | 3,147,088 | 907,213 |
| 2095 | 3,163,140 | 910,422 |
| 2094 | 3,179,046 | 913,693 |
| 2093 | 3,194,797 | 916,720 |
| 2092 | 3,209,692 | 919,754 |
| 2091 | 3,224,841 | 922,566 |
| 2090 | 3,239,446 | 925,355 |
| 2089 | 3,254,302 | 928,338 |
| 2088 | 3,269,115 | 931,122 |
| 2087 | 3,284,011 | 933,697 |
| 2086 | 3,298,437 | 936,460 |
| 2085 | 3,313,192 | 939,094 |
| 2084 | 3,327,434 | 941,456 |
| 2083 | 3,341,286 | 943,457 |
| 2082 | 3,355,214 | 945,740 |
| 2081 | 3,368,911 | 947,585 |
| 2080 | 3,382,244 | 949,719 |
| 2079 | 3,396,024 | 951,522 |
| 2078 | 3,410,227 | 953,282 |
| 2077 | 3,424,676 | 954,797 |
| 2076 | 3,439,894 | 956,257 |
| 2075 | 3,455,072 | 957,459 |
| 2074 | 3,469,703 | 958,504 |
| 2073 | 3,484,340 | 959,702 |
| 2072 | 3,498,926 | 960,812 |
| 2071 | 3,513,371 | 961,668 |
| 2070 | 3,528,520 | 962,203 |
| 2069 | 3,544,057 | 962,904 |
| 2068 | 3,559,495 | 963,022 |
| 2067 | 3,575,004 | 963,054 |
| 2066 | 3,590,926 | 962,921 |
| 2065 | 3,607,114 | 962,791 |
| 2064 | 3,622,820 | 962,542 |
| 2063 | 3,637,969 | 962,076 |
| 2062 | 3,652,682 | 961,203 |
| 2061 | 3,666,528 | 960,260 |
| 2060 | 3,680,180 | 959,002 |
| 2059 | 3,693,482 | 957,472 |
| 2058 | 3,705,813 | 956,199 |
| 2057 | 3,717,709 | 954,833 |
| 2056 | 3,729,974 | 953,856 |
| 2055 | 3,741,446 | 952,473 |
| 2054 | 3,751,834 | 950,751 |
| 2053 | 3,762,225 | 948,550 |
| 2052 | 3,773,210 | 946,418 |
| 2051 | 3,782,880 | 944,600 |
| 2050 | 3,792,010 | 942,132 |
| 2049 | 3,800,334 | 939,501 |
| 2048 | 3,808,834 | 936,652 |
| 2047 | 3,816,936 | 933,791 |
| 2046 | 3,825,088 | 930,620 |
| 2045 | 3,832,457 | 927,519 |
| 2044 | 3,838,601 | 924,138 |
| 2043 | 3,844,640 | 920,425 |
| 2042 | 3,850,029 | 916,573 |
| 2041 | 3,855,284 | 912,228 |
| 2040 | 3,861,929 | 908,107 |
| 2039 | 3,867,567 | 903,833 |
| 2038 | 3,874,063 | 899,477 |
| 2037 | 3,880,743 | 895,081 |
| 2036 | 3,887,984 | 890,800 |
| 2035 | 3,894,028 | 886,268 |
| 2034 | 3,900,127 | 881,349 |
| 2033 | 3,905,266 | 876,484 |
| 2032 | 3,910,171 | 871,096 |
| 2031 | 3,915,886 | 866,145 |
| 2030 | 3,920,585 | 860,981 |
| 2029 | 3,925,124 | 856,128 |
| 2028 | 3,928,232 | 851,179 |
| 2027 | 3,931,570 | 845,822 |
| 2026 | 3,934,050 | 840,890 |
| 2025 | 3,935,766 | 835,986 |
| 2024 | 3,812,518 | 831,087 |
| 2023 | 3,715,483 | 826,353 |
| 2022 | 3,712,502 | 821,637 |
| 2021 | 3,708,610 | 815,482 |
| 2020 | 3,722,716 | 807,481 |
| 2019 | 3,720,161 | 807,665 |
| 2018 | 3,726,549 | 791,556 |
| 2017 | 3,728,004 | 768,479 |
| 2016 | 3,727,505 | 763,548 |
| 2015 | 3,725,276 | 758,781 |
| 2014 | 3,719,414 | 754,229 |
| 2013 | 3,717,668 | 750,021 |
| 2012 | 3,728,874 | 746,288 |
| 2011 | 3,756,441 | 746,153 |
| 2010 | 3,786,695 | 749,256 |
| 2009 | 3,814,419 | 752,094 |
| 2008 | 3,848,449 | 754,606 |
| 2007 | 3,860,158 | 756,861 |
| 2006 | 3,880,347 | 758,966 |
| 2005 | 3,902,469 | 760,914 |
| 2004 | 3,927,340 | 762,418 |
| 2003 | 3,951,736 | 763,101 |
| 2002 | 3,978,515 | 763,652 |
| 2001 | 4,014,373 | 764,477 |
| 2000 | 4,077,131 | 764,832 |
| 1999 | 4,157,192 | 764,483 |
| 1998 | 4,243,607 | 763,586 |
| 1997 | 4,349,913 | 762,245 |
| 1996 | 4,491,699 | 760,526 |
| 1995 | 4,657,722 | 758,388 |
| 1994 | 4,836,076 | 755,822 |
| 1993 | 4,911,100 | 752,965 |
| 1992 | 4,873,500 | 749,911 |
| 1991 | 4,835,900 | 747,861 |
| 1990 | 4,802,000 | 749,894 |
| 1989 | 4,803,300 | 754,865 |
| 1988 | 4,790,700 | 759,663 |
| 1987 | 4,743,500 | 764,120 |
| 1986 | 4,704,500 | 768,098 |
| 1985 | 4,662,900 | 771,477 |
| 1984 | 4,622,200 | 774,111 |
| 1983 | 4,582,900 | 775,891 |
| 1982 | 4,542,800 | 776,712 |
| 1981 | 4,504,500 | 776,453 |
| 1980 | 4,467,700 | 774,367 |
| 1979 | 4,430,200 | 770,062 |
| 1978 | 4,397,700 | 764,586 |
| 1977 | 4,372,100 | 758,654 |
| 1976 | 4,342,400 | 752,253 |
| 1975 | 4,311,200 | 745,393 |
| 1974 | 4,279,500 | 738,057 |
| 1973 | 4,242,500 | 730,138 |
| 1972 | 4,205,300 | 721,617 |
| 1971 | 4,163,000 | 712,662 |
| 1970 | 4,119,900 | 702,705 |
| 1969 | 4,080,300 | 690,223 |
| 1968 | 4,042,300 | 676,160 |
| 1967 | 4,005,800 | 662,311 |
| 1966 | 3,966,700 | 648,646 |
| 1965 | 3,921,600 | 635,128 |
| 1964 | 3,870,300 | 621,764 |
| 1963 | 3,816,100 | 608,537 |
| 1962 | 3,760,300 | 595,461 |
| 1961 | 3,703,600 | 582,568 |
| 1960 | 3,645,600 | 569,143 |
Data sources: United Nations | World Population Prospects (2026–2100, retrieved 2026-07-08); World Bank | Health (1960–2025, retrieved 2026-07-08).
GeoRank.org/population/georgia/guyana | CC BY 
From 2006 to 2016, the population of Georgia decreased by 152,842 people (a 3.94% decline), while Guyana gained 4,582 people (a 0.6% growth).
For the next 10 years, from 2016 to 2026, Georgia gained 206,545 people (a 5.54% growth), while Guyana's population increased by 79,875 people (a 10.5% growth).
Georgia was ranked 124th most populous country in 2006 and is 129th in 2026. Guyana was ranked 160th in 2006 and ranked 162nd now.
The UN's World Population Prospects forecasts that in 24 years (in 2050) Georgia's population will shrink by 3.61% to 3,792,010 people with a rank change from 129th to 135th. The population of Guyana will increase by 11.7% to 942,132 people and will still be ranked 162nd.
Guyana is projected to reach its peak in 2067 at 963K people, while Georgia's population already peaked in 1993 at 4.91M people and is projected to decrease to 3.08M people by 2100.
Population growth rate by year
| Year | Growth rate | |
|---|---|---|
|
Georgia
|
Guyana
|
|
| 2100 | -0.57% | -0.41% |
| 2099 | -0.56% | -0.41% |
| 2098 | -0.55% | -0.35% |
| 2097 | -0.53% | -0.37% |
| 2096 | -0.51% | -0.35% |
| 2095 | -0.5% | -0.36% |
| 2094 | -0.49% | -0.33% |
| 2093 | -0.46% | -0.33% |
| 2092 | -0.47% | -0.3% |
| 2091 | -0.45% | -0.3% |
| 2090 | -0.46% | -0.32% |
| 2089 | -0.45% | -0.3% |
| 2088 | -0.45% | -0.28% |
| 2087 | -0.44% | -0.3% |
| 2086 | -0.45% | -0.28% |
| 2085 | -0.43% | -0.25% |
| 2084 | -0.41% | -0.21% |
| 2083 | -0.42% | -0.24% |
| 2082 | -0.41% | -0.19% |
| 2081 | -0.39% | -0.22% |
| 2080 | -0.41% | -0.19% |
| 2079 | -0.42% | -0.18% |
| 2078 | -0.42% | -0.16% |
| 2077 | -0.44% | -0.15% |
| 2076 | -0.44% | -0.13% |
| 2075 | -0.42% | -0.11% |
| 2074 | -0.42% | -0.12% |
| 2073 | -0.42% | -0.12% |
| 2072 | -0.41% | -0.09% |
| 2071 | -0.43% | -0.06% |
| 2070 | -0.44% | -0.07% |
| 2069 | -0.43% | -0.01% |
| 2068 | -0.43% | -0.003% |
| 2067 | -0.44% | 0.01% |
| 2066 | -0.45% | 0.01% |
| 2065 | -0.43% | 0.03% |
| 2064 | -0.42% | 0.05% |
| 2063 | -0.4% | 0.09% |
| 2062 | -0.38% | 0.1% |
| 2061 | -0.37% | 0.13% |
| 2060 | -0.36% | 0.16% |
| 2059 | -0.33% | 0.13% |
| 2058 | -0.32% | 0.14% |
| 2057 | -0.33% | 0.1% |
| 2056 | -0.31% | 0.15% |
| 2055 | -0.28% | 0.18% |
| 2054 | -0.28% | 0.23% |
| 2053 | -0.29% | 0.23% |
| 2052 | -0.26% | 0.19% |
| 2051 | -0.24% | 0.26% |
| 2050 | -0.22% | 0.28% |
| 2049 | -0.22% | 0.3% |
| 2048 | -0.21% | 0.31% |
| 2047 | -0.21% | 0.34% |
| 2046 | -0.19% | 0.33% |
| 2045 | -0.16% | 0.37% |
| 2044 | -0.16% | 0.4% |
| 2043 | -0.14% | 0.42% |
| 2042 | -0.14% | 0.48% |
| 2041 | -0.17% | 0.45% |
| 2040 | -0.15% | 0.47% |
| 2039 | -0.17% | 0.48% |
| 2038 | -0.17% | 0.49% |
| 2037 | -0.19% | 0.48% |
| 2036 | -0.16% | 0.51% |
| 2035 | -0.16% | 0.56% |
| 2034 | -0.13% | 0.56% |
| 2033 | -0.13% | 0.62% |
| 2032 | -0.15% | 0.57% |
| 2031 | -0.12% | 0.6% |
| 2030 | -0.12% | 0.57% |
| 2029 | -0.08% | 0.58% |
| 2028 | -0.08% | 0.63% |
| 2027 | -0.06% | 0.59% |
| 2026 | -0.04% | 0.59% |
| 2025 | 3.23% | 0.59% |
| 2024 | 2.61% | 0.57% |
| 2023 | 0.08% | 0.57% |
| 2022 | 0.1% | 0.75% |
| 2021 | -0.38% | 0.99% |
| 2020 | 0.07% | -0.02% |
| 2019 | -0.17% | 2.04% |
| 2018 | -0.04% | 3% |
| 2017 | 0.01% | 0.65% |
| 2016 | 0.06% | 0.63% |
| 2015 | 0.16% | 0.6% |
| 2014 | 0.05% | 0.56% |
| 2013 | -0.3% | 0.5% |
| 2012 | -0.73% | 0.02% |
| 2011 | -0.8% | -0.41% |
| 2010 | -0.73% | -0.38% |
| 2009 | -0.88% | -0.33% |
| 2008 | -0.3% | -0.3% |
| 2007 | -0.52% | -0.28% |
| 2006 | -0.57% | -0.26% |
| 2005 | -0.63% | -0.2% |
| 2004 | -0.62% | -0.09% |
| 2003 | -0.67% | -0.07% |
| 2002 | -0.89% | -0.11% |
| 2001 | -1.54% | -0.05% |
| 2000 | -1.93% | 0.05% |
| 1999 | -2.04% | 0.12% |
| 1998 | -2.44% | 0.18% |
| 1997 | -3.16% | 0.23% |
| 1996 | -3.56% | 0.28% |
| 1995 | -3.69% | 0.34% |
| 1994 | -1.53% | 0.38% |
| 1993 | 0.77% | 0.41% |
| 1992 | 0.78% | 0.27% |
| 1991 | 0.71% | -0.27% |
| 1990 | -0.03% | -0.66% |
| 1989 | 0.26% | -0.63% |
| 1988 | 1% | -0.58% |
| 1987 | 0.83% | -0.52% |
| 1986 | 0.89% | -0.44% |
| 1985 | 0.88% | -0.34% |
| 1984 | 0.86% | -0.23% |
| 1983 | 0.88% | -0.11% |
| 1982 | 0.85% | 0.03% |
| 1981 | 0.82% | 0.27% |
| 1980 | 0.85% | 0.56% |
| 1979 | 0.74% | 0.72% |
| 1978 | 0.59% | 0.78% |
| 1977 | 0.68% | 0.85% |
| 1976 | 0.72% | 0.92% |
| 1975 | 0.74% | 0.99% |
| 1974 | 0.87% | 1.08% |
| 1973 | 0.88% | 1.18% |
| 1972 | 1.02% | 1.26% |
| 1971 | 1.05% | 1.42% |
| 1970 | 0.97% | 1.81% |
| 1969 | 0.94% | 2.08% |
| 1968 | 0.91% | 2.09% |
| 1967 | 0.99% | 2.11% |
| 1966 | 1.15% | 2.13% |
| 1965 | 1.33% | 2.15% |
| 1964 | 1.42% | 2.17% |
| 1963 | 1.48% | 2.2% |
| 1962 | 1.53% | 2.21% |
| 1961 | 1.59% | 2.36% |
Data sources: United Nations | World Population Prospects (2026–2100, retrieved 2026-07-08); World Bank | Health (1961–2025, retrieved 2026-07-08).
GeoRank.org/population/georgia/guyana | CC BY
In 2025, the population of Georgia grew by 3.23%, while Guyana's population grew by 0.59%.
Live population counters
|
Georgia
|
Guyana
|
|
|---|---|---|
| Current population |
3934050
|
843423
|
| Population rank | 129/197 | 162/197 |
| Percent of world population | 0.05% | 0.01% |
| One net population change |
4.28 minutes
|
1.79 hours
|
| One birth every |
12.2 minutes
|
31.8 minutes
|
| One death every |
11.6 minutes
|
1.41 hours
|
| Daily growth/decline | +338 | +13 |
| Annual growth/decline | +123,248 | +4,899 |
| Annual growth/decline rate | +3.23% | +0.59% |
| Population growth rate rank | 11/197 | 124/197 |
| One migration net change every |
6.85 hours
|
1.73 hours
|
| Annual migration change | +1,283 | -5,092 |
| Net migration rank | 61/196 | 116/196 |
| Foreign-born residents | 81,582 | 54,175 |
| Foreign-born residents rank | 137/195 | 147/195 |
| Foreign-born share of population | 2.1% | 6.5% |
| Foreign-born share rank | 133/195 | 82/195 |
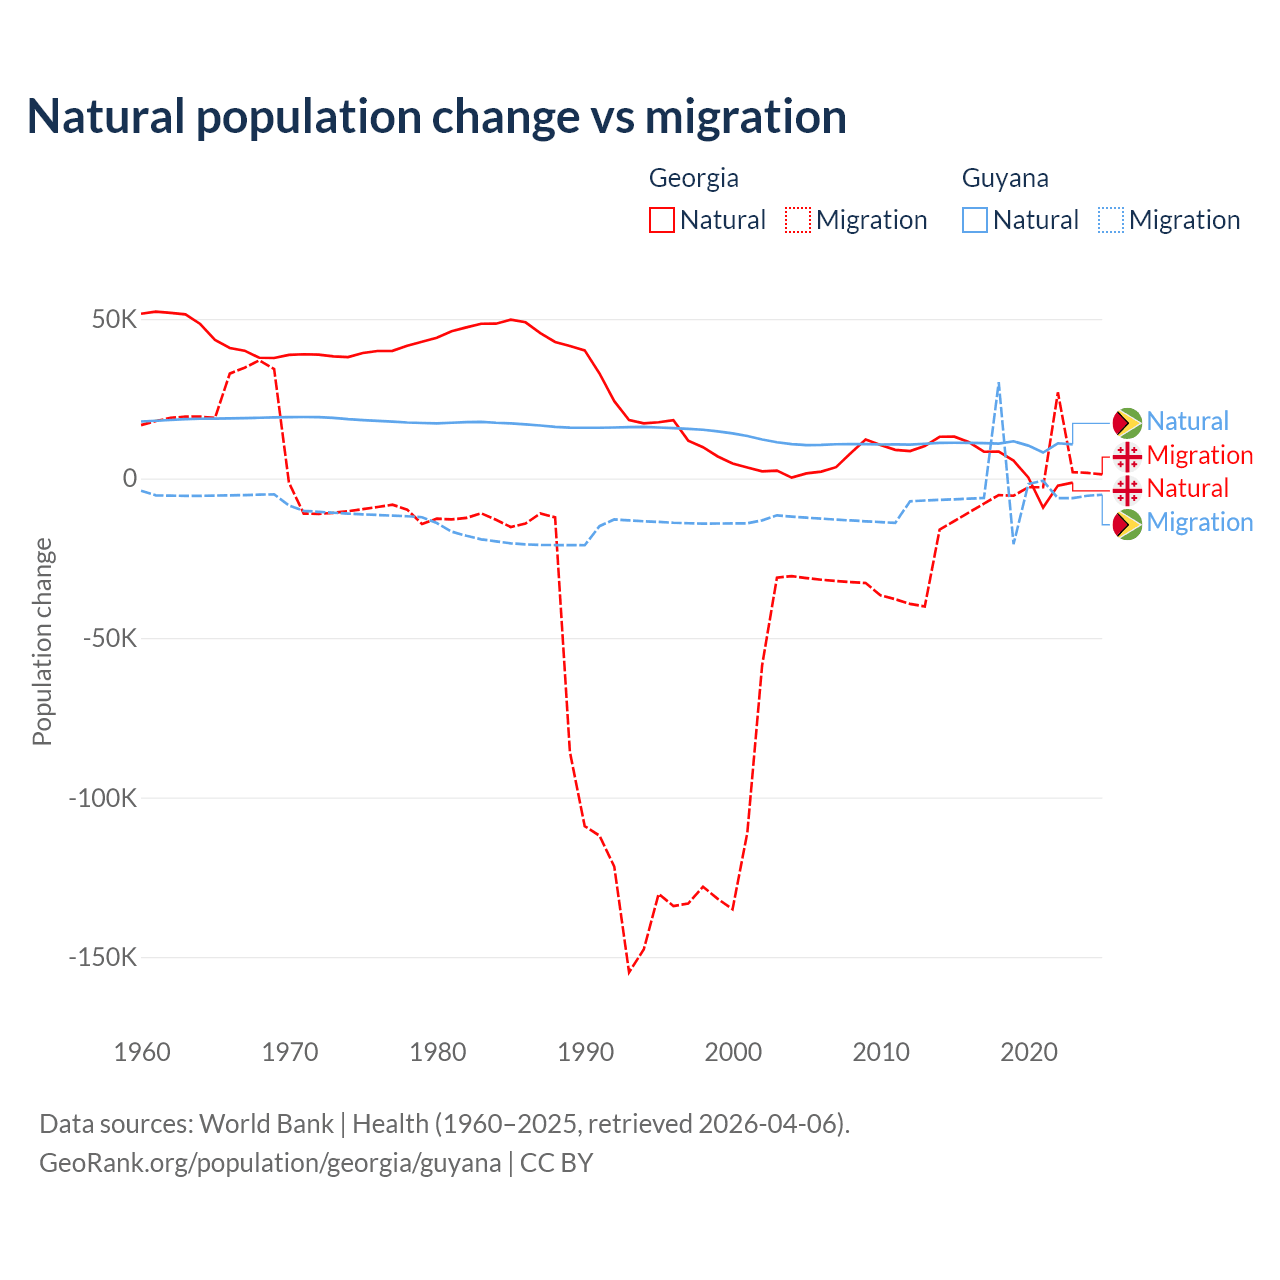
Natural population change vs migration
| Year | Population change | |||
|---|---|---|---|---|
|
Georgia
|
Guyana
|
|||
| Natural | Migration | Natural | Migration | |
| 2025 | - | 1,283 | - | -5,092 |
| 2024 | -2,085 | 1,745 | 10,310 | -5,407 |
| 2023 | -1,282 | 2,003 | 10,716 | -6,161 |
| 2022 | -2,224 | 26,999 | 11,042 | -6,161 |
| 2021 | -9,127 | -2,738 | 8,125 | -689 |
| 2020 | 335 | -2,738 | 10,307 | -1,743 |
| 2019 | 5,606 | -5,412 | 11,665 | -20,603 |
| 2018 | 8,407 | -5,176 | 10,946 | 30,213 |
| 2017 | 8,391 | -7,889 | 11,108 | -6,107 |
| 2016 | 11,346 | -10,588 | 11,168 | -6,309 |
| 2015 | 13,105 | -13,321 | 11,199 | -6,527 |
| 2014 | 13,089 | -16,047 | 11,143 | -6,710 |
| 2013 | 10,145 | -40,117 | 10,887 | -6,907 |
| 2012 | 8,584 | -39,290 | 10,633 | -7,152 |
| 2011 | 8,989 | -37,847 | 10,713 | -13,920 |
| 2010 | 10,501 | -36,608 | 10,652 | -13,655 |
| 2009 | 12,210 | -32,757 | 10,758 | -13,425 |
| 2008 | 7,974 | -32,463 | 10,792 | -13,143 |
| 2007 | 3,551 | -32,142 | 10,741 | -12,906 |
| 2006 | 2,146 | -31,729 | 10,525 | -12,575 |
| 2005 | 1,604 | -31,216 | 10,455 | -12,290 |
| 2004 | 283 | -30,614 | 10,767 | -11,938 |
| 2003 | 2,482 | -31,075 | 11,344 | -11,551 |
| 2002 | 2,228 | -58,531 | 12,218 | -13,116 |
| 2001 | 3,445 | -110,969 | 13,307 | -14,050 |
| 2000 | 4,681 | -135,046 | 14,128 | -14,090 |
| 1999 | 6,901 | -131,768 | 14,763 | -14,115 |
| 1998 | 9,823 | -127,962 | 15,292 | -14,155 |
| 1997 | 11,862 | -133,250 | 15,568 | -14,019 |
| 1996 | 18,304 | -133,999 | 15,768 | -13,871 |
| 1995 | 17,644 | -130,201 | 15,991 | -13,614 |
| 1994 | 17,279 | -147,551 | 16,185 | -13,426 |
| 1993 | 18,303 | -154,788 | 16,099 | -13,137 |
| 1992 | 24,226 | -121,647 | 15,990 | -12,844 |
| 1991 | 32,932 | -111,958 | 15,896 | -14,949 |
| 1990 | 40,169 | -108,969 | 15,917 | -20,930 |
| 1989 | 41,510 | -85,690 | 15,947 | -20,870 |
| 1988 | 42,810 | -12,189 | 16,189 | -20,860 |
| 1987 | 45,561 | -10,966 | 16,600 | -20,848 |
| 1986 | 48,960 | -14,123 | 16,940 | -20,647 |
| 1985 | 49,786 | -15,208 | 17,292 | -20,337 |
| 1984 | 48,523 | -12,920 | 17,466 | -19,702 |
| 1983 | 48,496 | -10,906 | 17,753 | -19,075 |
| 1982 | 47,363 | -12,363 | 17,644 | -17,959 |
| 1981 | 46,185 | -12,822 | 17,471 | -16,648 |
| 1980 | 44,114 | -12,593 | 17,298 | -13,952 |
| 1979 | 42,863 | -14,281 | 17,402 | -12,138 |
| 1978 | 41,616 | -9,755 | 17,539 | -11,841 |
| 1977 | 40,023 | -8,213 | 17,805 | -11,636 |
| 1976 | 39,964 | -8,952 | 18,083 | -11,445 |
| 1975 | 39,331 | -9,605 | 18,317 | -11,231 |
| 1974 | 38,071 | -10,261 | 18,589 | -11,012 |
| 1973 | 38,259 | -10,763 | 18,991 | -10,731 |
| 1972 | 38,832 | -11,097 | 19,219 | -10,448 |
| 1971 | 38,953 | -10,997 | 19,273 | -10,142 |
| 1970 | 38,731 | -1,311 | 19,233 | -8,439 |
| 1969 | 37,764 | 34,301 | 19,133 | -4,969 |
| 1968 | 37,840 | 37,031 | 19,035 | -5,071 |
| 1967 | 40,070 | 34,734 | 18,933 | -5,192 |
| 1966 | 40,905 | 32,869 | 18,862 | -5,277 |
| 1965 | 43,463 | 18,981 | 18,791 | -5,347 |
| 1964 | 48,429 | 19,377 | 18,729 | -5,437 |
| 1963 | 51,456 | 19,405 | 18,606 | -5,434 |
| 1962 | 51,903 | 18,981 | 18,344 | -5,379 |
| 1961 | 52,284 | 18,016 | 18,092 | -5,267 |
| 1960 | 51,640 | 16,740 | 17,867 | -3,837 |
Data sources: World Bank | Health (1960–2025, retrieved 2026-07-08).
GeoRank.org/population/georgia/guyana | CC BY
Over the last 10 years, 65.5% of the population change in Georgia is from natural causes (a gain of 32,472 people) and 34.5% is from migration (a loss of 17,115 people). In Guyana 78.3% is from natural causes (a gain of 106,586 people) and 21.7% is from migration (a loss of 29,494 people).
As of 2024, 81,582 residents or 2.1% of the population were not native-born in Georgia, compared to 54,175 people or 6.5% in Guyana.
Biggest cities by population
Compare countries by 7 more topics
Population differences between Georgia and Guyana
|
Georgia
|
Guyana
|
|
|---|---|---|
| Life expectancy | 75 years | 70.6 years |
| Average age | 38.8 years | 30.4 years |
| Median age | 38.3 years | 27.2 years |
| Male:Female ratio | 46.6:53.4 | 48.7:51.3 |
| Fertility rate | 1.8 births per woman | 2.4 births per woman |
| Population density | 146.6 ppl/mi² | 10.3 ppl/mi² |
Population map with other countries
Data sources: World Bank | Health (1960–2025, retrieved 2026-07-08); United Nations | World Population Prospects (1960–2026, retrieved 2026-07-08); U.S. Census Bureau (1960–2025, retrieved 2026-07-08); Central Intelligence Agency (CIA) (2000–2019, retrieved 2026-07-08).
GeoRank.org/population/georgia/guyana | CC BY
Help us show the world through your eyes
Share a photo of your city and help others discover what it looks like to live there. Your contribution makes our data come alive.
Data sources:
- World Bank | Health (1960–2025, retrieved 2026-07-08)
- United Nations | World Population Prospects (1960–2100, retrieved 2026-07-08)
- U.S. Census Bureau (1960–2025, retrieved 2026-07-08)
- Central Intelligence Agency (CIA) (2000–2019, retrieved 2026-07-08)
- Wikidata (2026, retrieved 2026-07-08)
Creative Commons Attribution (CC BY) — you’re free to copy, share, remix, adapt, and use even commercially as long as you give appropriate credit and clearly indicate if you made changes. Other sources may be subject to different license terms.