The latest officially reported population of the Bahamas was 403,033 in 2025 vs 112,832,473 people in the DR Congo in 2025. In 2026, based on the adjusted UN estimation, the current Bahamas' population is 405,486 people compared to 118,386,491 in the DR Congo.
Population statistics:
- The DR Congo's population is 292 times bigger than the Bahamas'.
- The Bahamas is ranked the 172nd most populous country in the world, while the DR Congo is the 14th.
- The countries together account for 1.43% of the world: 0.005% for the Bahamas vs 1.42% for the DR Congo.
- For the last 10 years, the Bahamas has had an average growth rate of +0.48% per year vs +3.36% in the DR Congo.
- Since 2006, the population of the Bahamas has increased from 348K people to 405K (16.4% growth), while the DR Congo has grown from 60.6M to 118M (95.3% growth).
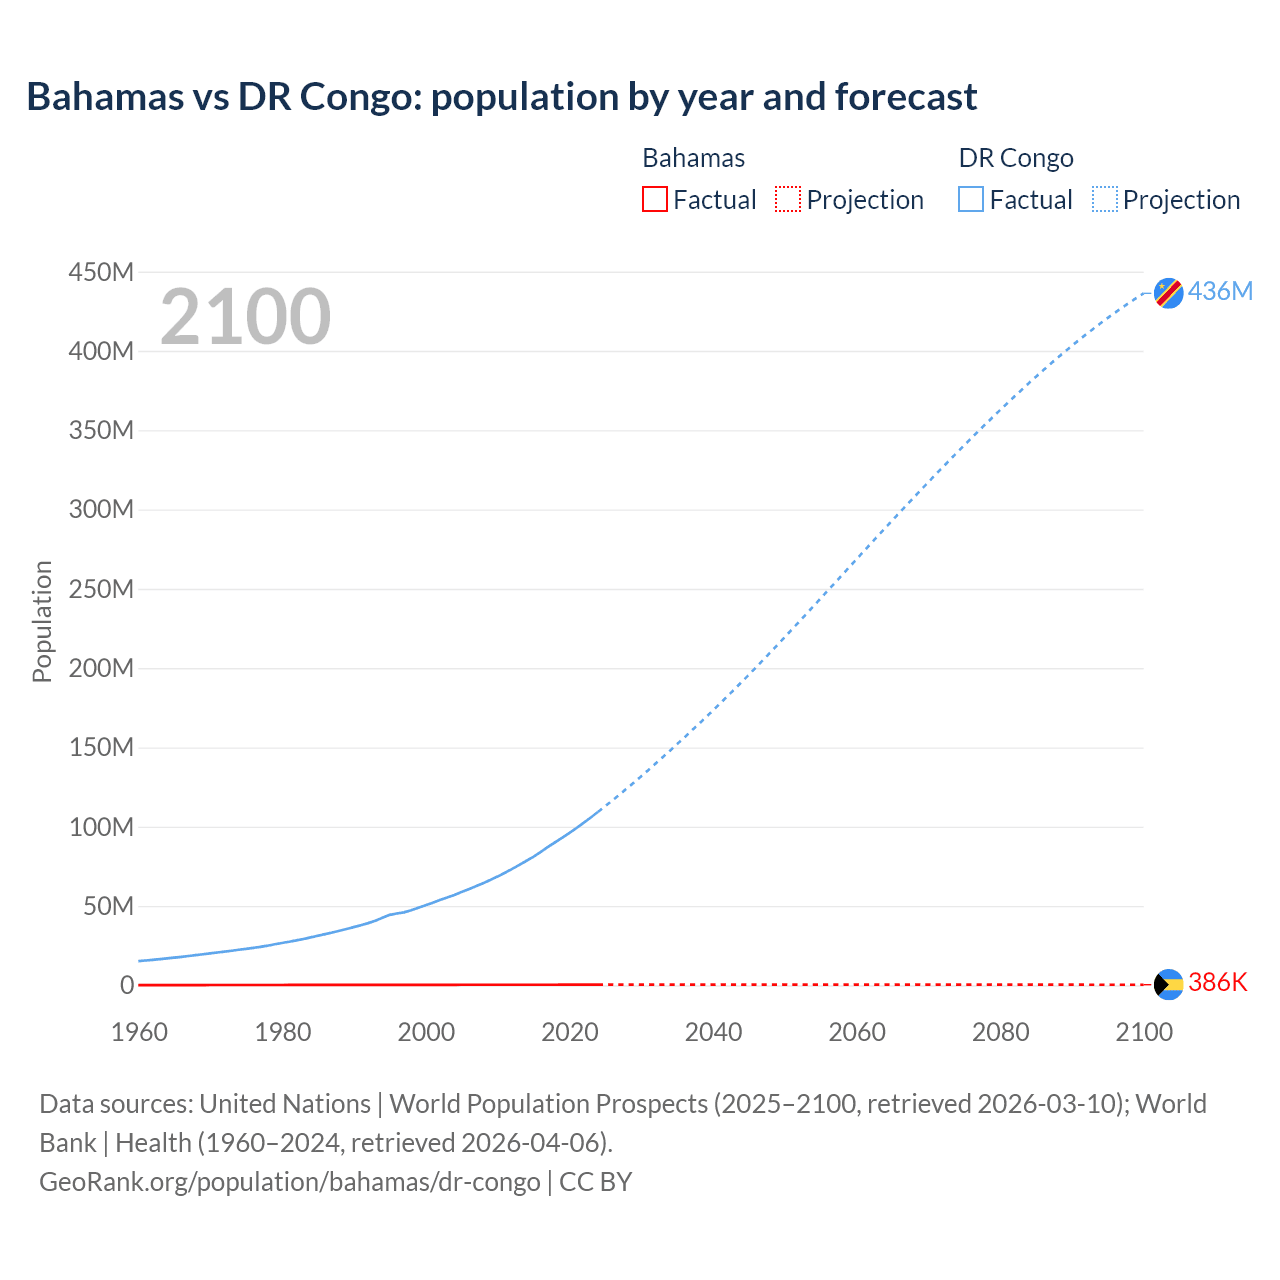
Bahamas vs DR Congo: population by year and forecast
| Year | Population | |
|---|---|---|
 Bahamas
|
 DR Congo
|
|
| 2100 | 386,242 | 436,237,219 |
| 2099 | 387,195 | 433,289,774 |
| 2098 | 388,161 | 430,252,622 |
| 2097 | 389,099 | 427,149,320 |
| 2096 | 390,060 | 423,961,963 |
| 2095 | 391,132 | 420,678,721 |
| 2094 | 392,157 | 417,304,547 |
| 2093 | 393,185 | 413,867,290 |
| 2092 | 394,229 | 410,362,003 |
| 2091 | 395,325 | 406,763,717 |
| 2090 | 396,424 | 403,089,566 |
| 2089 | 397,544 | 399,334,389 |
| 2088 | 398,720 | 395,507,774 |
| 2087 | 399,866 | 391,613,249 |
| 2086 | 401,035 | 387,639,503 |
| 2085 | 402,119 | 383,604,733 |
| 2084 | 403,257 | 379,495,246 |
| 2083 | 404,328 | 375,330,369 |
| 2082 | 405,372 | 371,124,615 |
| 2081 | 406,313 | 366,878,238 |
| 2080 | 407,298 | 362,574,665 |
| 2079 | 408,230 | 358,227,097 |
| 2078 | 409,153 | 353,821,014 |
| 2077 | 410,073 | 349,368,182 |
| 2076 | 410,993 | 344,866,731 |
| 2075 | 411,891 | 340,338,504 |
| 2074 | 412,704 | 335,761,691 |
| 2073 | 413,670 | 331,157,281 |
| 2072 | 414,595 | 326,505,656 |
| 2071 | 415,421 | 321,830,769 |
| 2070 | 416,149 | 317,104,580 |
| 2069 | 416,887 | 312,349,776 |
| 2068 | 417,676 | 307,566,932 |
| 2067 | 418,393 | 302,762,490 |
| 2066 | 419,083 | 297,932,241 |
| 2065 | 419,762 | 293,081,284 |
| 2064 | 420,392 | 288,211,987 |
| 2063 | 420,997 | 283,315,009 |
| 2062 | 421,567 | 278,399,192 |
| 2061 | 422,069 | 273,464,914 |
| 2060 | 422,592 | 268,520,814 |
| 2059 | 423,123 | 263,570,338 |
| 2058 | 423,505 | 258,622,778 |
| 2057 | 423,815 | 253,685,085 |
| 2056 | 424,181 | 248,748,321 |
| 2055 | 424,453 | 243,814,854 |
| 2054 | 424,747 | 238,885,417 |
| 2053 | 424,900 | 233,971,468 |
| 2052 | 425,047 | 229,073,420 |
| 2051 | 425,131 | 224,197,775 |
| 2050 | 425,155 | 219,354,949 |
| 2049 | 425,081 | 214,547,398 |
| 2048 | 424,910 | 209,774,448 |
| 2047 | 424,738 | 205,040,532 |
| 2046 | 424,362 | 200,341,405 |
| 2045 | 423,916 | 195,693,533 |
| 2044 | 423,478 | 191,087,342 |
| 2043 | 422,936 | 186,534,055 |
| 2042 | 422,290 | 182,033,706 |
| 2041 | 421,598 | 177,583,290 |
| 2040 | 420,834 | 173,191,594 |
| 2039 | 420,067 | 168,846,440 |
| 2038 | 419,167 | 164,551,895 |
| 2037 | 418,240 | 160,316,591 |
| 2036 | 417,355 | 156,099,100 |
| 2035 | 416,322 | 151,924,296 |
| 2034 | 415,263 | 147,782,785 |
| 2033 | 414,133 | 143,684,929 |
| 2032 | 413,018 | 139,642,368 |
| 2031 | 411,762 | 135,634,548 |
| 2030 | 410,470 | 131,685,113 |
| 2029 | 409,117 | 127,793,612 |
| 2028 | 407,689 | 123,956,913 |
| 2027 | 406,231 | 120,188,952 |
| 2026 | 404,701 | 116,482,769 |
| 2025 | 403,033 | 112,832,473 |
| 2024 | 401,283 | 109,276,265 |
| 2023 | 399,440 | 105,789,731 |
| 2022 | 397,538 | 102,396,968 |
| 2021 | 396,373 | 99,148,932 |
| 2020 | 395,863 | 95,989,998 |
| 2019 | 394,675 | 92,947,442 |
| 2018 | 392,717 | 90,047,644 |
| 2017 | 390,485 | 87,083,398 |
| 2016 | 388,055 | 83,956,415 |
| 2015 | 385,346 | 81,035,531 |
| 2014 | 382,298 | 78,403,242 |
| 2013 | 378,953 | 75,789,395 |
| 2012 | 375,469 | 73,254,618 |
| 2011 | 371,729 | 70,849,311 |
| 2010 | 367,478 | 68,563,038 |
| 2009 | 362,810 | 66,412,044 |
| 2008 | 358,120 | 64,390,664 |
| 2007 | 353,334 | 62,477,752 |
| 2006 | 348,375 | 60,615,908 |
| 2005 | 343,894 | 58,775,724 |
| 2004 | 339,782 | 56,997,741 |
| 2003 | 335,618 | 55,343,867 |
| 2002 | 331,614 | 53,750,524 |
| 2001 | 327,836 | 52,132,646 |
| 2000 | 323,835 | 50,507,442 |
| 1999 | 319,614 | 48,912,971 |
| 1998 | 315,368 | 47,297,600 |
| 1997 | 310,904 | 46,029,902 |
| 1996 | 306,268 | 45,296,124 |
| 1995 | 301,461 | 44,433,704 |
| 1994 | 296,509 | 42,626,876 |
| 1993 | 291,339 | 40,656,336 |
| 1992 | 285,927 | 39,228,910 |
| 1991 | 280,731 | 37,925,817 |
| 1990 | 275,945 | 36,684,063 |
| 1989 | 271,178 | 35,486,866 |
| 1988 | 266,448 | 34,382,752 |
| 1987 | 261,935 | 33,298,904 |
| 1986 | 257,536 | 32,265,196 |
| 1985 | 253,154 | 31,264,816 |
| 1984 | 248,863 | 30,245,081 |
| 1983 | 244,698 | 29,250,963 |
| 1982 | 240,614 | 28,338,190 |
| 1981 | 236,614 | 27,500,515 |
| 1980 | 232,526 | 26,711,099 |
| 1979 | 228,230 | 25,886,782 |
| 1978 | 223,761 | 24,992,689 |
| 1977 | 219,157 | 24,229,061 |
| 1976 | 214,501 | 23,624,031 |
| 1975 | 209,886 | 23,021,101 |
| 1974 | 205,342 | 22,418,878 |
| 1973 | 200,791 | 21,827,665 |
| 1972 | 196,055 | 21,251,160 |
| 1971 | 190,857 | 20,695,569 |
| 1970 | 184,982 | 20,137,436 |
| 1969 | 177,981 | 19,570,445 |
| 1968 | 170,089 | 19,012,189 |
| 1967 | 162,267 | 18,462,782 |
| 1966 | 154,874 | 17,931,929 |
| 1965 | 147,952 | 17,427,802 |
| 1964 | 141,528 | 16,955,327 |
| 1963 | 135,087 | 16,507,599 |
| 1962 | 128,493 | 16,075,724 |
| 1961 | 122,197 | 15,662,374 |
| 1960 | 116,317 | 15,264,846 |
Data sources: United Nations | World Population Prospects (2026–2100, retrieved 2026-07-08); World Bank | Health (1960–2025, retrieved 2026-07-08).
GeoRank.org/population/bahamas/dr-congo | CC BY 
From 2006 to 2016, the population of the Bahamas increased by 39,680 people (a 11.4% growth), while the DR Congo gained 23,340,507 people (a 38.5% growth).
For the next 10 years, from 2016 to 2026, the Bahamas gained 17,431 people (a 4.49% growth), while the DR Congo's population increased by 34,430,076 people (a 41% growth).
The Bahamas was ranked 170th most populous country in 2006 and is 172nd in 2026. The DR Congo was ranked 22nd in 2006 and ranked 14th now.
The UN's World Population Prospects forecasts that in 24 years (in 2050) the Bahamas' population will grow by 4.85% to 425,155 people with a rank change from 172nd to 174th. The population of the DR Congo will increase by 85.3% to 219,354,949 people and rank change from 14th to 8th.
The Bahamas is projected to reach its peak in 2050 at 425K people compared to the peak of 436M people in 2100 for the DR Congo.
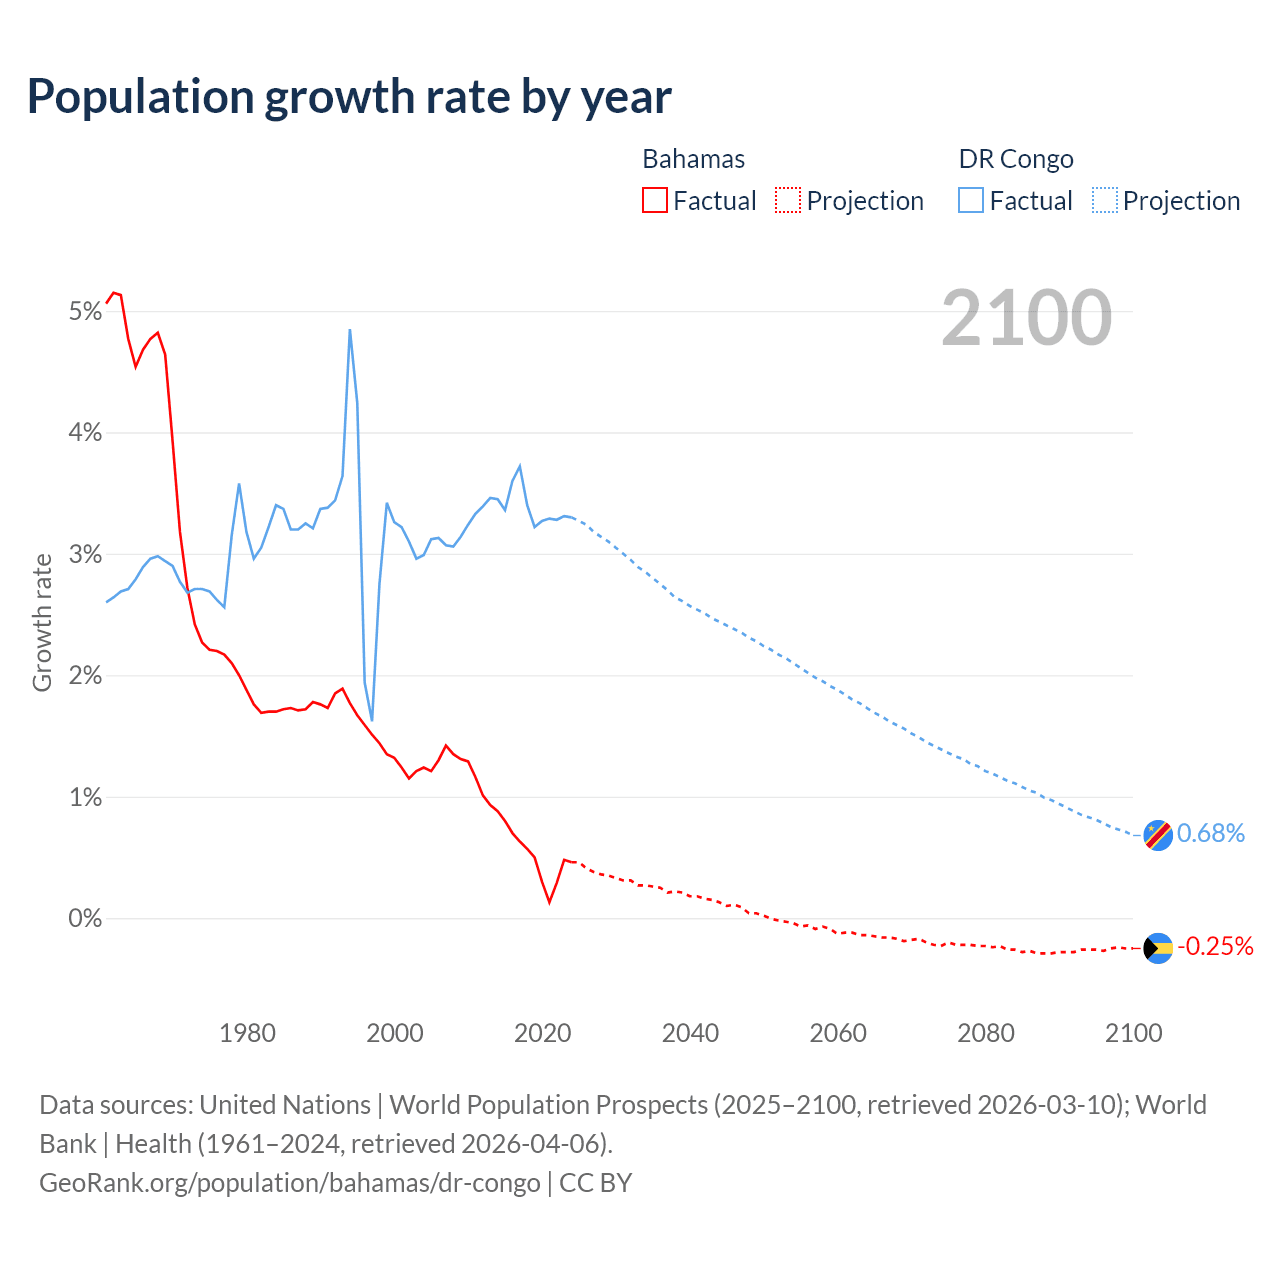
Population growth rate by year
| Year | Growth rate | |
|---|---|---|
|
Bahamas
|
DR Congo
|
|
| 2100 | -0.25% | 0.68% |
| 2099 | -0.25% | 0.71% |
| 2098 | -0.24% | 0.73% |
| 2097 | -0.25% | 0.75% |
| 2096 | -0.27% | 0.78% |
| 2095 | -0.26% | 0.81% |
| 2094 | -0.26% | 0.83% |
| 2093 | -0.26% | 0.85% |
| 2092 | -0.28% | 0.88% |
| 2091 | -0.28% | 0.91% |
| 2090 | -0.28% | 0.94% |
| 2089 | -0.29% | 0.97% |
| 2088 | -0.29% | 0.99% |
| 2087 | -0.29% | 1.03% |
| 2086 | -0.27% | 1.05% |
| 2085 | -0.28% | 1.08% |
| 2084 | -0.26% | 1.11% |
| 2083 | -0.26% | 1.13% |
| 2082 | -0.23% | 1.16% |
| 2081 | -0.24% | 1.19% |
| 2080 | -0.23% | 1.21% |
| 2079 | -0.23% | 1.25% |
| 2078 | -0.22% | 1.27% |
| 2077 | -0.22% | 1.31% |
| 2076 | -0.22% | 1.33% |
| 2075 | -0.2% | 1.36% |
| 2074 | -0.23% | 1.39% |
| 2073 | -0.22% | 1.42% |
| 2072 | -0.2% | 1.45% |
| 2071 | -0.17% | 1.49% |
| 2070 | -0.18% | 1.52% |
| 2069 | -0.19% | 1.56% |
| 2068 | -0.17% | 1.59% |
| 2067 | -0.16% | 1.62% |
| 2066 | -0.16% | 1.66% |
| 2065 | -0.15% | 1.69% |
| 2064 | -0.14% | 1.73% |
| 2063 | -0.14% | 1.77% |
| 2062 | -0.12% | 1.8% |
| 2061 | -0.12% | 1.84% |
| 2060 | -0.13% | 1.88% |
| 2059 | -0.09% | 1.91% |
| 2058 | -0.07% | 1.95% |
| 2057 | -0.09% | 1.98% |
| 2056 | -0.06% | 2.02% |
| 2055 | -0.07% | 2.06% |
| 2054 | -0.04% | 2.1% |
| 2053 | -0.03% | 2.14% |
| 2052 | -0.02% | 2.17% |
| 2051 | -0.006% | 2.21% |
| 2050 | 0.02% | 2.24% |
| 2049 | 0.04% | 2.28% |
| 2048 | 0.04% | 2.31% |
| 2047 | 0.09% | 2.35% |
| 2046 | 0.11% | 2.38% |
| 2045 | 0.1% | 2.41% |
| 2044 | 0.13% | 2.44% |
| 2043 | 0.15% | 2.47% |
| 2042 | 0.16% | 2.51% |
| 2041 | 0.18% | 2.54% |
| 2040 | 0.18% | 2.57% |
| 2039 | 0.21% | 2.61% |
| 2038 | 0.22% | 2.64% |
| 2037 | 0.21% | 2.7% |
| 2036 | 0.25% | 2.75% |
| 2035 | 0.26% | 2.8% |
| 2034 | 0.27% | 2.85% |
| 2033 | 0.27% | 2.89% |
| 2032 | 0.31% | 2.95% |
| 2031 | 0.31% | 3% |
| 2030 | 0.33% | 3.05% |
| 2029 | 0.35% | 3.1% |
| 2028 | 0.36% | 3.14% |
| 2027 | 0.38% | 3.18% |
| 2026 | 0.41% | 3.24% |
| 2025 | 0.44% | 3.25% |
| 2024 | 0.46% | 3.3% |
| 2023 | 0.48% | 3.31% |
| 2022 | 0.29% | 3.28% |
| 2021 | 0.13% | 3.29% |
| 2020 | 0.3% | 3.27% |
| 2019 | 0.5% | 3.22% |
| 2018 | 0.57% | 3.4% |
| 2017 | 0.63% | 3.72% |
| 2016 | 0.7% | 3.6% |
| 2015 | 0.8% | 3.36% |
| 2014 | 0.88% | 3.45% |
| 2013 | 0.93% | 3.46% |
| 2012 | 1.01% | 3.39% |
| 2011 | 1.16% | 3.33% |
| 2010 | 1.29% | 3.24% |
| 2009 | 1.31% | 3.14% |
| 2008 | 1.35% | 3.06% |
| 2007 | 1.42% | 3.07% |
| 2006 | 1.3% | 3.13% |
| 2005 | 1.21% | 3.12% |
| 2004 | 1.24% | 2.99% |
| 2003 | 1.21% | 2.96% |
| 2002 | 1.15% | 3.1% |
| 2001 | 1.24% | 3.22% |
| 2000 | 1.32% | 3.26% |
| 1999 | 1.35% | 3.42% |
| 1998 | 1.44% | 2.75% |
| 1997 | 1.51% | 1.62% |
| 1996 | 1.59% | 1.94% |
| 1995 | 1.67% | 4.24% |
| 1994 | 1.77% | 4.85% |
| 1993 | 1.89% | 3.64% |
| 1992 | 1.85% | 3.44% |
| 1991 | 1.73% | 3.38% |
| 1990 | 1.76% | 3.37% |
| 1989 | 1.78% | 3.21% |
| 1988 | 1.72% | 3.25% |
| 1987 | 1.71% | 3.2% |
| 1986 | 1.73% | 3.2% |
| 1985 | 1.72% | 3.37% |
| 1984 | 1.7% | 3.4% |
| 1983 | 1.7% | 3.22% |
| 1982 | 1.69% | 3.05% |
| 1981 | 1.76% | 2.96% |
| 1980 | 1.88% | 3.18% |
| 1979 | 2% | 3.58% |
| 1978 | 2.1% | 3.15% |
| 1977 | 2.17% | 2.56% |
| 1976 | 2.2% | 2.62% |
| 1975 | 2.21% | 2.69% |
| 1974 | 2.27% | 2.71% |
| 1973 | 2.42% | 2.71% |
| 1972 | 2.72% | 2.68% |
| 1971 | 3.18% | 2.77% |
| 1970 | 3.93% | 2.9% |
| 1969 | 4.64% | 2.94% |
| 1968 | 4.82% | 2.98% |
| 1967 | 4.77% | 2.96% |
| 1966 | 4.68% | 2.89% |
| 1965 | 4.54% | 2.79% |
| 1964 | 4.77% | 2.71% |
| 1963 | 5.13% | 2.69% |
| 1962 | 5.15% | 2.64% |
| 1961 | 5.06% | 2.6% |
Data sources: United Nations | World Population Prospects (2026–2100, retrieved 2026-07-08); World Bank | Health (1961–2025, retrieved 2026-07-08).
GeoRank.org/population/bahamas/dr-congo | CC BY
In 2025, the population of the Bahamas grew by 0.44%, while the DR Congo's population grew by 3.25%.
Live population counters
|
Bahamas
|
DR Congo
|
|
|---|---|---|
| Current population |
405486
|
118386491
|
| Population rank | 172/197 | 14/197 |
| Percent of world population | 0.005% | 1.42% |
| One net population change |
5.02 hours
|
8.89 seconds
|
| One birth every |
2.02 hours
|
7.06 seconds
|
| One death every |
2.49 hours
|
34.3 seconds
|
| Daily growth/decline | +5 | +9,743 |
| Annual growth/decline | +1,750 | +3,556,208 |
| Annual growth/decline rate | +0.44% | +3.25% |
| Population growth rate rank | 135/197 | 10/197 |
| One migration net change every |
9.39 hours
|
19.3 minutes
|
| Annual migration change | +935 | -27,309 |
| Net migration rank | 64/196 | 159/196 |
| Foreign-born residents | 67,285 | 1,085,090 |
| Foreign-born residents rank | 144/195 | 57/195 |
| Foreign-born share of population | 16.8% | 1% |
| Foreign-born share rank | 38/195 | 152/195 |
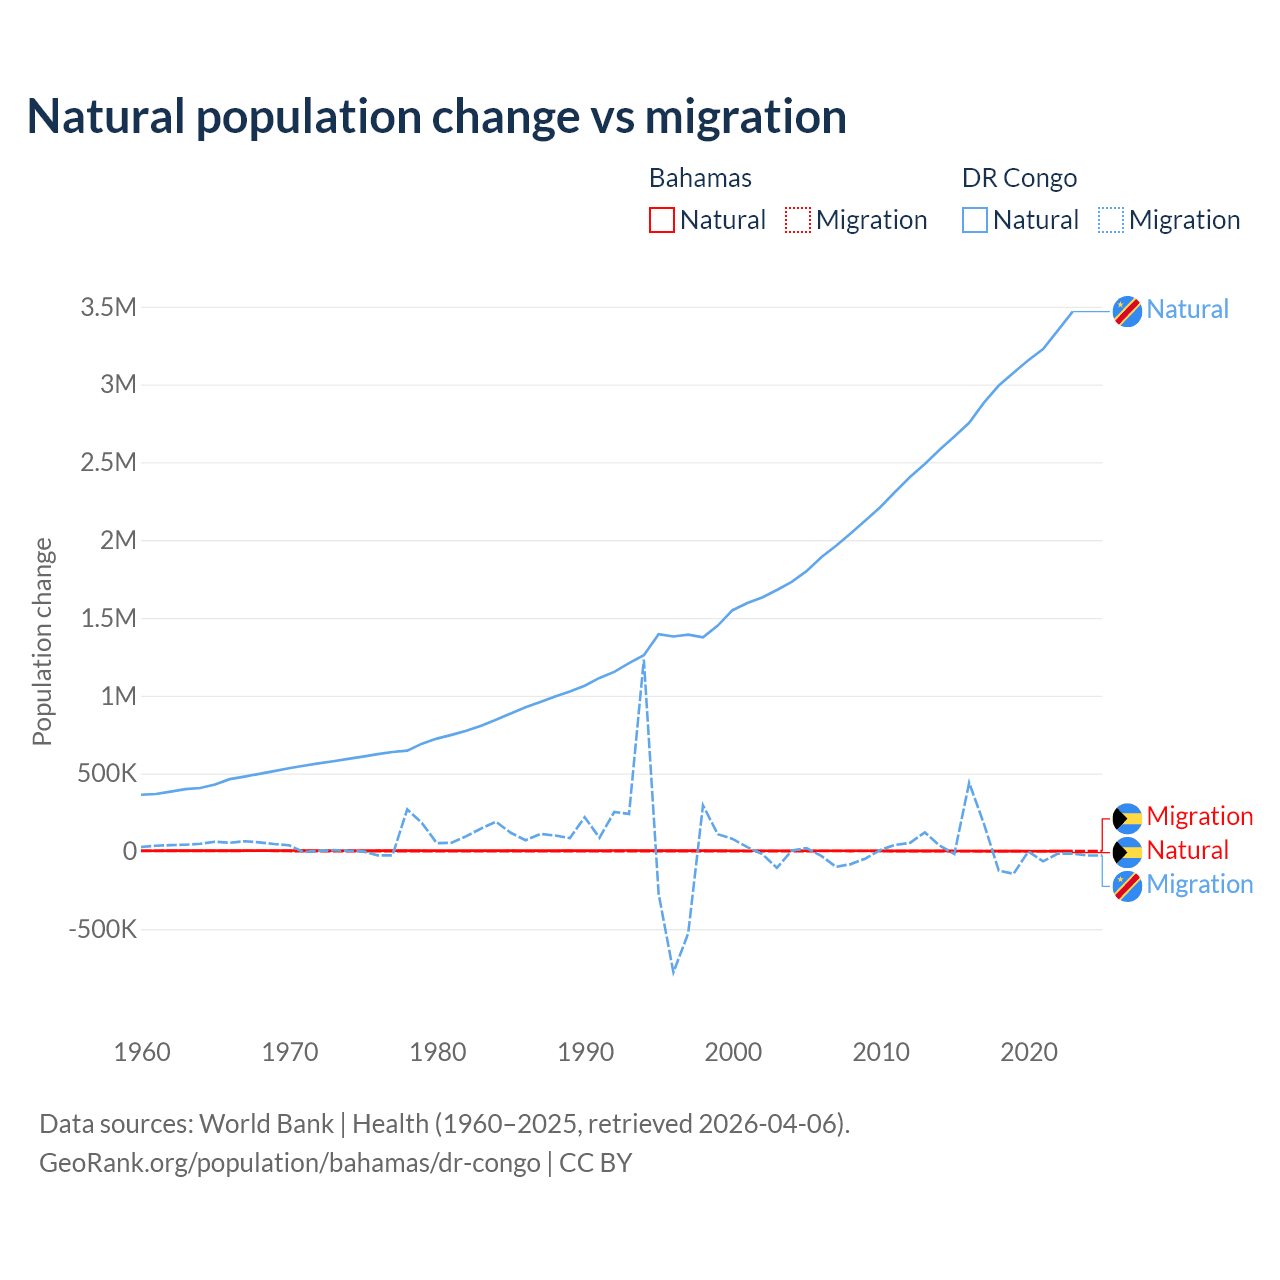
Natural population change vs migration
| Year | Population change | |||
|---|---|---|---|---|
|
Bahamas
|
DR Congo
|
|||
| Natural | Migration | Natural | Migration | |
| 2025 | - | 935 | - | -27,309 |
| 2024 | 821 | 1,018 | 3,547,217 | -26,968 |
| 2023 | 854 | 1,001 | 3,467,787 | -14,992 |
| 2022 | 947 | 1,001 | 3,347,664 | -14,991 |
| 2021 | -93 | 481 | 3,227,992 | -64,639 |
| 2020 | 631 | 0 | 3,156,152 | -1,633 |
| 2019 | 740 | 1,002 | 3,075,538 | -144,920 |
| 2018 | 1,173 | 1,002 | 2,993,184 | -124,246 |
| 2017 | 1,289 | 1,002 | 2,883,245 | 176,290 |
| 2016 | 1,569 | 1,002 | 2,753,687 | 440,748 |
| 2015 | 1,840 | 1,002 | 2,665,016 | -17,711 |
| 2014 | 2,259 | 1,002 | 2,580,251 | 36,966 |
| 2013 | 2,432 | 1,002 | 2,489,378 | 121,097 |
| 2012 | 2,485 | 1,047 | 2,405,462 | 53,668 |
| 2011 | 2,558 | 1,381 | 2,310,679 | 40,891 |
| 2010 | 2,662 | 1,898 | 2,212,255 | 8,823 |
| 2009 | 3,163 | 1,613 | 2,126,912 | -46,009 |
| 2008 | 3,134 | 1,474 | 2,044,210 | -82,339 |
| 2007 | 3,243 | 1,727 | 1,963,738 | -99,742 |
| 2006 | 3,205 | 1,735 | 1,889,398 | -29,715 |
| 2005 | 3,220 | 804 | 1,800,300 | 20,384 |
| 2004 | 3,165 | 1,030 | 1,731,022 | 4,260 |
| 2003 | 3,181 | 949 | 1,679,188 | -106,731 |
| 2002 | 3,249 | 636 | 1,631,597 | -17,358 |
| 2001 | 3,377 | 290 | 1,594,999 | 26,523 |
| 2000 | 3,487 | 845 | 1,549,518 | 79,340 |
| 1999 | 3,688 | 418 | 1,450,318 | 109,761 |
| 1998 | 3,949 | 437 | 1,375,130 | 295,560 |
| 1997 | 4,107 | 445 | 1,392,037 | -527,356 |
| 1996 | 4,265 | 454 | 1,380,490 | -777,833 |
| 1995 | 4,434 | 460 | 1,395,440 | -273,434 |
| 1994 | 4,558 | 454 | 1,259,539 | 1,232,105 |
| 1993 | 4,877 | 445 | 1,209,242 | 240,176 |
| 1992 | 5,064 | 433 | 1,152,781 | 252,666 |
| 1991 | 4,498 | 412 | 1,114,033 | 86,721 |
| 1990 | 4,432 | 241 | 1,063,508 | 219,270 |
| 1989 | 4,323 | 523 | 1,027,238 | 84,415 |
| 1988 | 4,198 | 413 | 995,278 | 101,314 |
| 1987 | 4,090 | 326 | 959,875 | 111,220 |
| 1986 | 3,998 | 389 | 925,334 | 70,988 |
| 1985 | 3,918 | 469 | 885,670 | 118,791 |
| 1984 | 3,892 | 302 | 844,956 | 190,045 |
| 1983 | 3,888 | 243 | 807,122 | 146,095 |
| 1982 | 3,863 | 160 | 774,823 | 97,495 |
| 1981 | 3,851 | 125 | 748,371 | 54,656 |
| 1980 | 3,845 | 367 | 724,111 | 51,685 |
| 1979 | 3,899 | 484 | 691,773 | 181,028 |
| 1978 | 3,987 | 563 | 646,411 | 268,974 |
| 1977 | 4,069 | 586 | 638,242 | -26,355 |
| 1976 | 4,167 | 490 | 624,147 | -25,965 |
| 1975 | 4,249 | 323 | 608,655 | -972 |
| 1974 | 4,352 | 164 | 593,539 | 3,216 |
| 1973 | 4,467 | 125 | 578,280 | 7,414 |
| 1972 | 4,583 | 296 | 564,495 | 2,840 |
| 1971 | 4,690 | 825 | 549,343 | -5,497 |
| 1970 | 4,726 | 1,517 | 533,300 | 39,116 |
| 1969 | 4,688 | 3,068 | 514,800 | 46,778 |
| 1968 | 4,622 | 3,405 | 497,682 | 57,274 |
| 1967 | 4,502 | 3,123 | 479,552 | 64,307 |
| 1966 | 4,339 | 2,816 | 463,397 | 54,443 |
| 1965 | 4,193 | 2,488 | 429,002 | 61,397 |
| 1964 | 4,037 | 2,129 | 406,334 | 48,207 |
| 1963 | 3,901 | 2,814 | 398,972 | 41,960 |
| 1962 | 3,748 | 2,729 | 383,406 | 39,431 |
| 1961 | 3,577 | 2,547 | 368,207 | 35,654 |
| 1960 | 3,351 | 2,290 | 363,517 | 27,673 |
Data sources: World Bank | Health (1960–2025, retrieved 2026-07-08).
GeoRank.org/population/bahamas/dr-congo | CC BY
Over the last 10 years, 53.4% of the population change in the Bahamas is from natural causes (a gain of 9,771 people) and 46.6% is from migration (a gain of 8,511 people). In the DR Congo 99.3% is from natural causes (a gain of 31,117,482 people) and 0.66% is from migration (a gain of 206,938 people).
As of 2024, 67,285 residents or 16.8% of the population were not native-born in the Bahamas, compared to 1,085,090 people or 1% in the DR Congo.
Biggest cities by population
Compare countries by 7 more topics
Population differences between the Bahamas and the DR Congo
|
Bahamas
|
DR Congo
|
|
|---|---|---|
| Life expectancy | 75 years | 62.4 years |
| Average age | 37.8 years | 21.9 years |
| Median age | 36.4 years | 16.9 years |
| Male:Female ratio | 47.7:52.3 | 49.6:50.4 |
| Fertility rate | 1.37 births per woman | 5.98 births per woman |
| Population density | 104.7 ppl/mi² | 133.1 ppl/mi² |
Population map with other countries
Data sources: World Bank | Health (1960–2025, retrieved 2026-07-08); United Nations | World Population Prospects (1960–2026, retrieved 2026-07-08); U.S. Census Bureau (1960–2025, retrieved 2026-07-08); Central Intelligence Agency (CIA) (2000–2019, retrieved 2026-07-08).
GeoRank.org/population/bahamas/dr-congo | CC BY
Help us show the world through your eyes
Share a photo of your city and help others discover what it looks like to live there. Your contribution makes our data come alive.
Data sources:
- World Bank | Health (1960–2025, retrieved 2026-07-08)
- United Nations | World Population Prospects (1960–2100, retrieved 2026-07-08)
- U.S. Census Bureau (1960–2025, retrieved 2026-07-08)
- Central Intelligence Agency (CIA) (2000–2019, retrieved 2026-07-08)
- Wikidata (2026, retrieved 2026-07-08)
Creative Commons Attribution (CC BY) — you’re free to copy, share, remix, adapt, and use even commercially as long as you give appropriate credit and clearly indicate if you made changes. Other sources may be subject to different license terms.