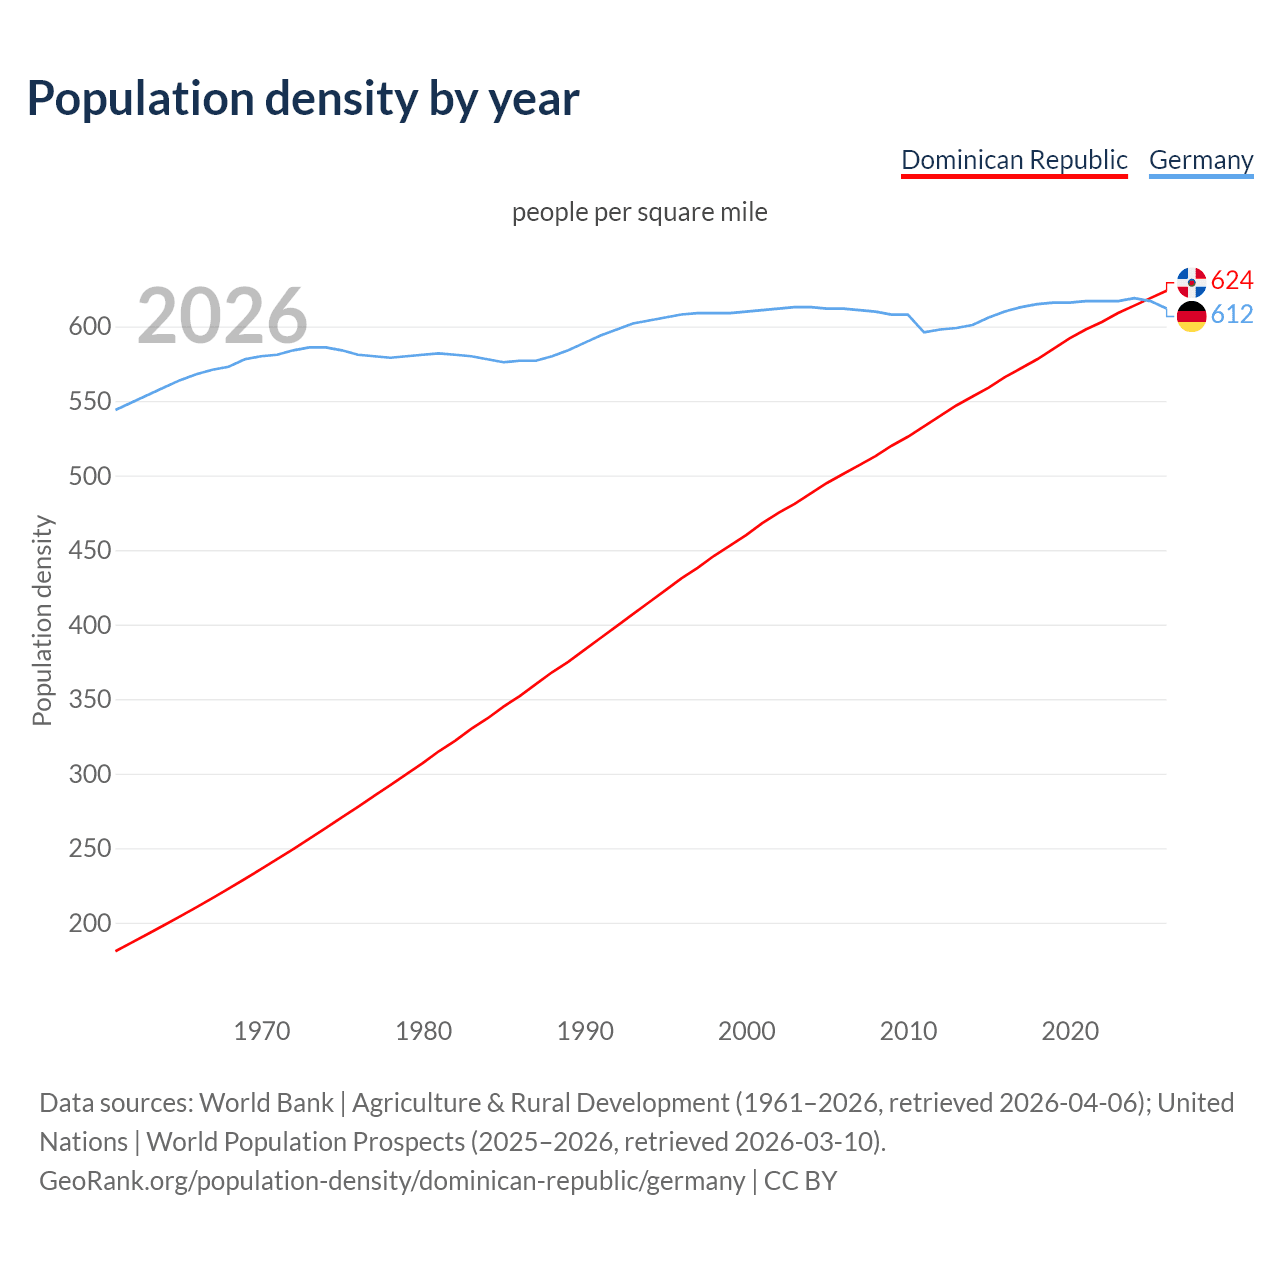
The Dominican Republic has a population density of 624 people per square mile compared to 614 people in Germany. The Dominican Republic has 45,474 sq ft of land per person vs 46,101 sq ft in Germany. The Dominican Republic and Germany rank 49th and 50th by population density, respectively.
Population density is calculated as the ratio of population to land area. The Dominican Republic has 0.14% of the world's population and 0.03% of all countries' land area, compared to 1.02% of the population and 0.23% of the land area for Germany, making the population density in the Dominican Republic 1.63% higher than in Germany.
Population density by year
people per square mile
| Year | Population density | |
|---|---|---|
 Dominican Republic
|
 Germany
|
|
| 2026 | 624 | 614 |
| 2025 | 619 | 619 |
| 2024 | 614 | 619 |
| 2023 | 609 | 617 |
| 2022 | 603 | 617 |
| 2021 | 598 | 617 |
| 2020 | 592 | 616 |
| 2019 | 585 | 616 |
| 2018 | 578 | 615 |
| 2017 | 572 | 613 |
| 2016 | 566 | 610 |
| 2015 | 559 | 606 |
| 2014 | 553 | 601 |
| 2013 | 547 | 599 |
| 2012 | 540 | 598 |
| 2011 | 533 | 596 |
| 2010 | 526 | 608 |
| 2009 | 520 | 608 |
| 2008 | 513 | 610 |
| 2007 | 507 | 611 |
| 2006 | 501 | 612 |
| 2005 | 495 | 612 |
| 2004 | 488 | 613 |
| 2003 | 481 | 613 |
| 2002 | 475 | 612 |
| 2001 | 468 | 611 |
| 2000 | 460 | 610 |
| 1999 | 453 | 609 |
| 1998 | 446 | 609 |
| 1997 | 438 | 609 |
| 1996 | 431 | 608 |
| 1995 | 423 | 606 |
| 1994 | 415 | 604 |
| 1993 | 407 | 602 |
| 1992 | 399 | 598 |
| 1991 | 391 | 594 |
| 1990 | 383 | 589 |
| 1989 | 375 | 584 |
| 1988 | 368 | 580 |
| 1987 | 360 | 577 |
| 1986 | 352 | 577 |
| 1985 | 345 | 576 |
| 1984 | 337 | 578 |
| 1983 | 330 | 580 |
| 1982 | 322 | 581 |
| 1981 | 315 | 582 |
| 1980 | 307 | 581 |
| 1979 | 299.7 | 580 |
| 1978 | 292.3 | 579 |
| 1977 | 285 | 580 |
| 1976 | 277.7 | 581 |
| 1975 | 270.6 | 584 |
| 1974 | 263.5 | 586 |
| 1973 | 256.4 | 586 |
| 1972 | 249.4 | 584 |
| 1971 | 242.6 | 581 |
| 1970 | 235.9 | 580 |
| 1969 | 229.3 | 578 |
| 1968 | 222.9 | 573 |
| 1967 | 216.5 | 571 |
| 1966 | 210.3 | 568 |
| 1965 | 204.2 | 564 |
| 1964 | 198.3 | 559 |
| 1963 | 192.4 | 554 |
| 1962 | 186.6 | 549 |
| 1961 | 180.8 | 544 |
Data sources: World Bank | Agriculture & Rural Development (1961–2026, retrieved 2026-07-08); United Nations | World Population Prospects (2026, retrieved 2026-07-08).
GeoRank.org/population-density/dominican-republic/germany | CC BY 
From 2006 to 2026, population density in the Dominican Republic increased by 24.6%, compared to a 0.35% growth in Germany.
In 2006, the Dominican Republic ranked 43rd by population density and is 49th now. Germany was 37th in 2006 and ranks 50th out of 197 currently.
Population density comparison
|
Dominican Republic
|
Germany
|
|
|---|---|---|
| Population density | 624 ppl/mi² | 614 ppl/mi² |
| Population density rank | 49/197 | 50/197 |
| Population |
11656588
|
82830814
|
| Land area | 18,609 sq mi | 134,916 sq mi |
| Land area per capita | 45,033 sq ft | 45,049 sq ft |
| Rural population | 27.5% | 17.9% |
| Urban population | 72.5% | 82.1% |
| Living in agglomerations of 1M+ people | 30.4% | 10% |
Share of urban population by year
| Year | Urban population | |
|---|---|---|
|
Dominican Republic
|
Germany
|
|
| 2025 | 72.5% | 82.1% |
| 2024 | 72.4% | 82% |
| 2023 | 72.4% | 81.9% |
| 2022 | 72.4% | 81.8% |
| 2021 | 72.9% | 81.6% |
| 2020 | 73.3% | 81.5% |
| 2019 | 73.5% | 81.3% |
| 2018 | 73.8% | 81.1% |
| 2017 | 73.9% | 81% |
| 2016 | 74.1% | 80.8% |
| 2015 | 74.1% | 80.7% |
| 2014 | 74.2% | 80.6% |
| 2013 | 74.2% | 80.5% |
| 2012 | 74.2% | 80.4% |
| 2011 | 74.2% | 80.3% |
| 2010 | 74.2% | 80.3% |
| 2009 | 73.6% | 80.3% |
| 2008 | 72.5% | 80.2% |
| 2007 | 71% | 80.2% |
| 2006 | 69.3% | 80.2% |
| 2005 | 67.6% | 80.2% |
| 2004 | 65.9% | 80.2% |
| 2003 | 64.4% | 80.1% |
| 2002 | 63.3% | 80.1% |
| 2001 | 62.3% | 80.1% |
| 2000 | 61.3% | 80.1% |
| 1999 | 60.4% | 80.1% |
| 1998 | 59.5% | 80.1% |
| 1997 | 58.6% | 80.1% |
| 1996 | 57.8% | 80.1% |
| 1995 | 57.1% | 80% |
| 1994 | 56.5% | 80% |
| 1993 | 56% | 80% |
| 1992 | 55.6% | 80% |
| 1991 | 55.3% | 80% |
| 1990 | 55% | 80% |
| 1989 | 54.7% | 80% |
| 1988 | 54.4% | 80% |
| 1987 | 54.2% | 80% |
| 1986 | 54% | 80% |
| 1985 | 53.7% | 80% |
| 1984 | 53.4% | 80% |
| 1983 | 53.1% | 80% |
| 1982 | 52.6% | 79.9% |
| 1981 | 52.1% | 79.9% |
| 1980 | 51.5% | 79.9% |
| 1979 | 50.7% | 79.9% |
| 1978 | 49.7% | 79.9% |
| 1977 | 48.6% | 79.9% |
| 1976 | 47.5% | 79.8% |
| 1975 | 46.3% | 79.8% |
| 1974 | 45% | 79.8% |
| 1973 | 43.8% | 79.8% |
| 1972 | 42.6% | 79.7% |
| 1971 | 41.4% | 79.7% |
| 1970 | 40.2% | 79.7% |
| 1969 | 39.2% | 79.6% |
| 1968 | 38.1% | 79.4% |
| 1967 | 37.1% | 79.1% |
| 1966 | 36% | 78.7% |
| 1965 | 34.9% | 78.3% |
| 1964 | 33.9% | 77.7% |
| 1963 | 32.9% | 77.2% |
| 1962 | 31.9% | 76.7% |
| 1961 | 31% | 76.2% |
| 1960 | 30.2% | 75.7% |
Data sources: World Bank | Health (1960–2025, retrieved 2026-07-08).
GeoRank.org/population-density/dominican-republic/germany | CC BY
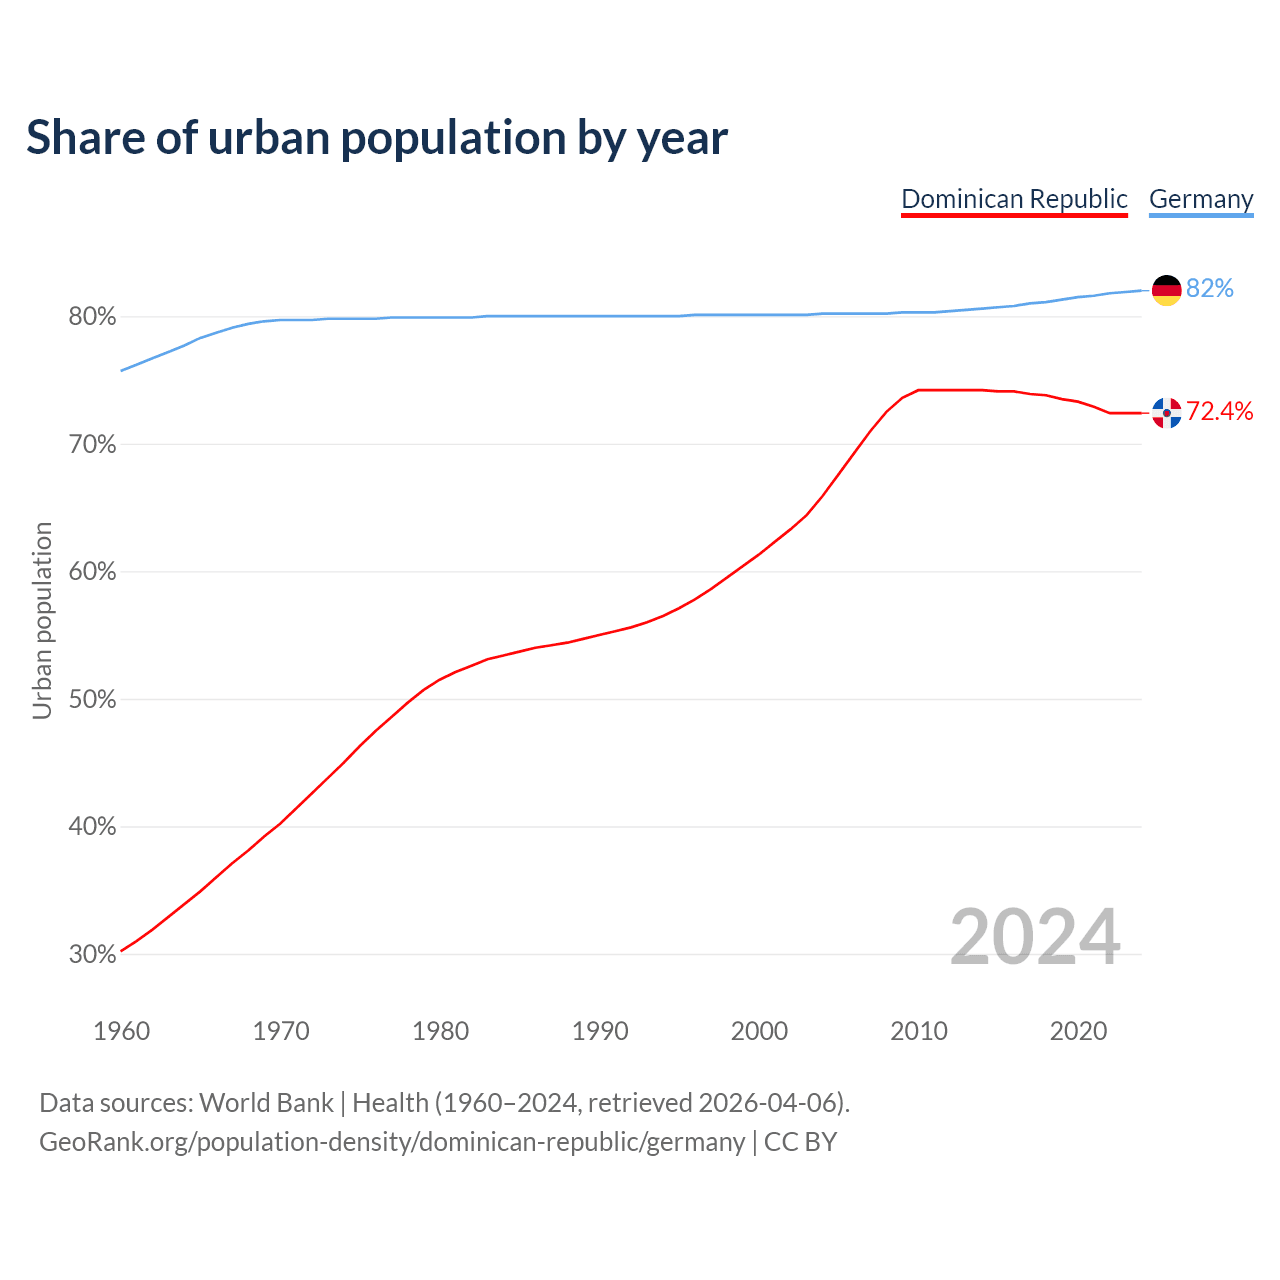
From 2005 to 2025, the share of urban population changed from 67.6% to 72.5% in the Dominican Republic and from 80.2% to 82.1% in Germany.
Densely populated cities
|
Dominican Republic
|
|
|---|---|
| City | Population |
| Santo Domingo | 2.2M |
| Santiago de los Caballeros | 1.34M |
| Puerto Plata | 338K |
| La Vega | 282K |
| Higuey | 251K |
| San Cristobal | 233K |
| San Pedro de Macoris | 217K |
| San Francisco de Macoris | 188K |
| San Juan de la Maguana | 169K |
| Bonao | 158K |
|
Germany
|
|
|---|---|
| City | Population |
| Berlin | 3.78M |
| Hamburg | 1.91M |
| Munich | 1.51M |
| Cologne | 1.09M |
| Frankfurt | 776K |
| Stuttgart | 633K |
| Dusseldorf | 631K |
| Leipzig | 620K |
| Dortmund | 595K |
| Essen | 587K |
Compare countries by 7 more topics
Population density in other countries

Data sources: World Bank | Agriculture & Rural Development (1961–2026, retrieved 2026-07-08); United Nations | World Population Prospects (1961–2026, retrieved 2026-07-08); U.S. Census Bureau (1961–2025, retrieved 2026-07-08); Central Intelligence Agency (CIA) (2000–2019, retrieved 2026-07-08).
GeoRank.org/population-density/dominican-republic/germany | CC BY
Help us show the world through your eyes
Share a photo of your city and help others discover what it looks like to live there. Your contribution makes our data come alive.
Data sources:
- World Bank | Agriculture & Rural Development (1961–2026, retrieved 2026-07-08)
- United Nations | World Population Prospects (1961–2026, retrieved 2026-07-08)
- U.S. Census Bureau (1961–2025, retrieved 2026-07-08)
- Wikidata (2010–2025, retrieved 2026-07-08)
- Central Intelligence Agency (CIA) (2000–2019, retrieved 2026-07-08)
Creative Commons Attribution (CC BY) — you’re free to copy, share, remix, adapt, and use even commercially as long as you give appropriate credit and clearly indicate if you made changes. Other sources may be subject to different license terms.