The average life expectancy at birth is 55 years in Nigeria vs 82.1 in Slovenia. Nigeria is ranked 197/197 by life expectancy, and Slovenia is 33/197. In Nigeria, the life expectancy is 54.6 years for males and 55.3 years for females. In Slovenia, it's 79.5 years for males and 84.7 years for females.
Nigeria vs Slovenia life expectancy at birth by year
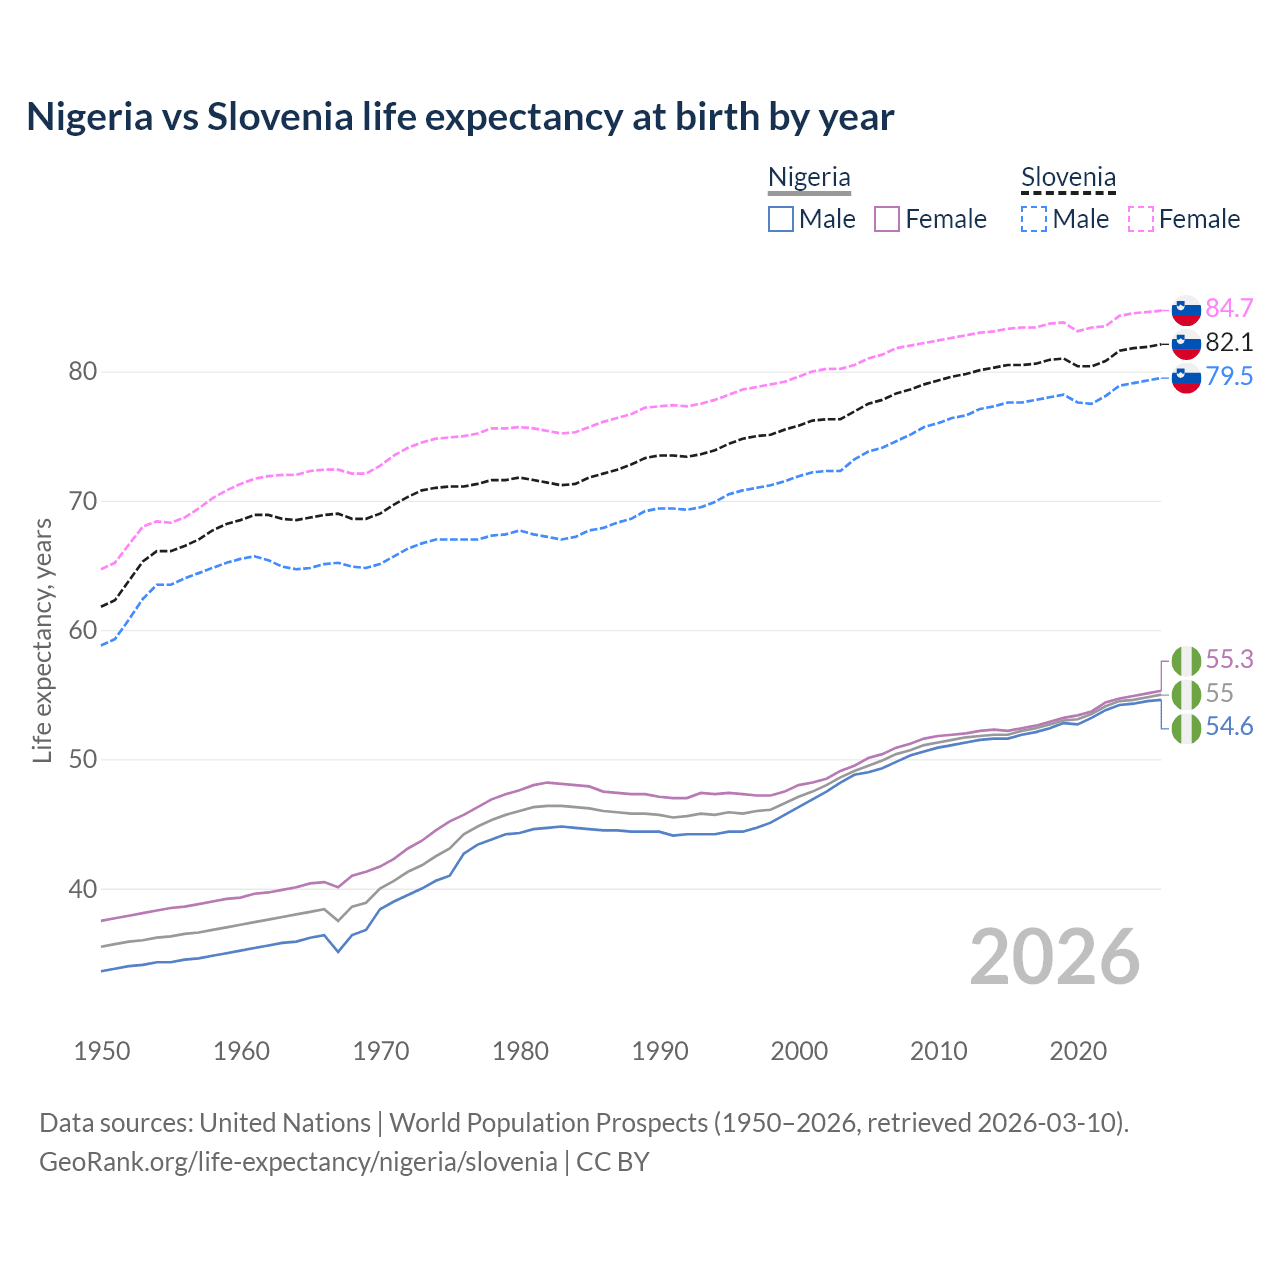
| Year | Life expectancy, years | |||||
|---|---|---|---|---|---|---|
 Nigeria
|
 Slovenia
|
|||||
| Average | Male | Female | Average | Male | Female | |
| 2026 | 55 | 54.6 | 55.3 | 82.1 | 79.5 | 84.7 |
| 2025 | 54.8 | 54.5 | 55.1 | 81.9 | 79.3 | 84.6 |
| 2024 | 54.6 | 54.3 | 54.9 | 81.8 | 79.1 | 84.5 |
| 2023 | 54.5 | 54.2 | 54.7 | 81.6 | 78.9 | 84.3 |
| 2022 | 54.1 | 53.8 | 54.4 | 80.8 | 78.1 | 83.5 |
| 2021 | 53.5 | 53.2 | 53.7 | 80.4 | 77.5 | 83.4 |
| 2020 | 53.1 | 52.7 | 53.4 | 80.4 | 77.6 | 83.1 |
| 2019 | 53 | 52.8 | 53.2 | 81 | 78.2 | 83.8 |
| 2018 | 52.7 | 52.4 | 52.9 | 80.9 | 78 | 83.7 |
| 2017 | 52.4 | 52.1 | 52.6 | 80.6 | 77.8 | 83.4 |
| 2016 | 52.2 | 51.9 | 52.4 | 80.5 | 77.6 | 83.4 |
| 2015 | 51.9 | 51.6 | 52.2 | 80.5 | 77.6 | 83.3 |
| 2014 | 51.9 | 51.6 | 52.3 | 80.3 | 77.3 | 83.1 |
| 2013 | 51.8 | 51.5 | 52.2 | 80.1 | 77.1 | 83 |
| 2012 | 51.7 | 51.3 | 52 | 79.8 | 76.6 | 82.8 |
| 2011 | 51.5 | 51.1 | 51.9 | 79.6 | 76.4 | 82.6 |
| 2010 | 51.3 | 50.9 | 51.8 | 79.3 | 76 | 82.4 |
| 2009 | 51.1 | 50.6 | 51.6 | 79 | 75.7 | 82.2 |
| 2008 | 50.7 | 50.3 | 51.2 | 78.6 | 75.1 | 82 |
| 2007 | 50.4 | 49.8 | 50.9 | 78.3 | 74.6 | 81.8 |
| 2006 | 49.9 | 49.3 | 50.4 | 77.8 | 74.1 | 81.3 |
| 2005 | 49.5 | 49 | 50.1 | 77.5 | 73.8 | 81 |
| 2004 | 49.1 | 48.8 | 49.5 | 76.9 | 73.2 | 80.5 |
| 2003 | 48.6 | 48.2 | 49.1 | 76.3 | 72.3 | 80.2 |
| 2002 | 48 | 47.5 | 48.5 | 76.3 | 72.3 | 80.2 |
| 2001 | 47.5 | 46.9 | 48.2 | 76.2 | 72.2 | 80 |
| 2000 | 47.1 | 46.3 | 48 | 75.8 | 71.9 | 79.6 |
| 1999 | 46.6 | 45.7 | 47.5 | 75.5 | 71.5 | 79.2 |
| 1998 | 46.1 | 45.1 | 47.2 | 75.1 | 71.2 | 79 |
| 1997 | 46 | 44.7 | 47.2 | 75 | 71 | 78.8 |
| 1996 | 45.8 | 44.4 | 47.3 | 74.8 | 70.8 | 78.6 |
| 1995 | 45.9 | 44.4 | 47.4 | 74.4 | 70.5 | 78.2 |
| 1994 | 45.7 | 44.2 | 47.3 | 73.9 | 69.9 | 77.8 |
| 1993 | 45.8 | 44.2 | 47.4 | 73.6 | 69.5 | 77.5 |
| 1992 | 45.6 | 44.2 | 47 | 73.4 | 69.3 | 77.3 |
| 1991 | 45.5 | 44.1 | 47 | 73.5 | 69.4 | 77.4 |
| 1990 | 45.7 | 44.4 | 47.1 | 73.5 | 69.4 | 77.3 |
| 1989 | 45.8 | 44.4 | 47.3 | 73.3 | 69.2 | 77.2 |
| 1988 | 45.8 | 44.4 | 47.3 | 72.8 | 68.6 | 76.7 |
| 1987 | 45.9 | 44.5 | 47.4 | 72.4 | 68.3 | 76.4 |
| 1986 | 46 | 44.5 | 47.5 | 72.1 | 67.9 | 76.1 |
| 1985 | 46.2 | 44.6 | 47.9 | 71.8 | 67.7 | 75.7 |
| 1984 | 46.3 | 44.7 | 48 | 71.3 | 67.2 | 75.3 |
| 1983 | 46.4 | 44.8 | 48.1 | 71.2 | 67 | 75.2 |
| 1982 | 46.4 | 44.7 | 48.2 | 71.4 | 67.2 | 75.4 |
| 1981 | 46.3 | 44.6 | 48 | 71.6 | 67.4 | 75.6 |
| 1980 | 46 | 44.3 | 47.6 | 71.8 | 67.7 | 75.7 |
| 1979 | 45.7 | 44.2 | 47.3 | 71.6 | 67.4 | 75.6 |
| 1978 | 45.3 | 43.8 | 46.9 | 71.6 | 67.3 | 75.6 |
| 1977 | 44.8 | 43.4 | 46.3 | 71.3 | 67 | 75.2 |
| 1976 | 44.2 | 42.7 | 45.7 | 71.1 | 67 | 75 |
| 1975 | 43.1 | 41 | 45.2 | 71.1 | 67 | 74.9 |
| 1974 | 42.5 | 40.6 | 44.5 | 71 | 67 | 74.8 |
| 1973 | 41.8 | 40 | 43.7 | 70.8 | 66.7 | 74.5 |
| 1972 | 41.3 | 39.5 | 43.1 | 70.3 | 66.3 | 74.1 |
| 1971 | 40.6 | 39 | 42.3 | 69.7 | 65.7 | 73.5 |
| 1970 | 40 | 38.4 | 41.7 | 69 | 65.1 | 72.7 |
| 1969 | 38.9 | 36.8 | 41.3 | 68.6 | 64.8 | 72.1 |
| 1968 | 38.6 | 36.4 | 41 | 68.6 | 64.9 | 72.1 |
| 1967 | 37.5 | 35.1 | 40.1 | 69 | 65.2 | 72.4 |
| 1966 | 38.4 | 36.4 | 40.5 | 68.9 | 65.1 | 72.4 |
| 1965 | 38.2 | 36.2 | 40.4 | 68.7 | 64.8 | 72.3 |
| 1964 | 38 | 35.9 | 40.1 | 68.5 | 64.7 | 72 |
| 1963 | 37.8 | 35.8 | 39.9 | 68.6 | 64.9 | 72 |
| 1962 | 37.6 | 35.6 | 39.7 | 68.9 | 65.4 | 71.9 |
| 1961 | 37.4 | 35.4 | 39.6 | 68.9 | 65.7 | 71.7 |
| 1960 | 37.2 | 35.2 | 39.3 | 68.5 | 65.5 | 71.3 |
| 1959 | 37 | 35 | 39.2 | 68.2 | 65.2 | 70.8 |
| 1958 | 36.8 | 34.8 | 39 | 67.7 | 64.8 | 70.2 |
| 1957 | 36.6 | 34.6 | 38.8 | 67 | 64.4 | 69.4 |
| 1956 | 36.5 | 34.5 | 38.6 | 66.5 | 64 | 68.7 |
| 1955 | 36.3 | 34.3 | 38.5 | 66.1 | 63.5 | 68.3 |
| 1954 | 36.2 | 34.3 | 38.3 | 66.1 | 63.5 | 68.4 |
| 1953 | 36 | 34.1 | 38.1 | 65.3 | 62.4 | 68 |
| 1952 | 35.9 | 34 | 37.9 | 63.8 | 60.8 | 66.6 |
| 1951 | 35.7 | 33.8 | 37.7 | 62.3 | 59.3 | 65.2 |
| 1950 | 35.5 | 33.6 | 37.5 | 61.8 | 58.8 | 64.7 |
Data sources: United Nations | World Population Prospects (1950–2026, retrieved 2026-07-08).
GeoRank.org/life-expectancy/nigeria/slovenia | CC BY 
Life expectancy is the average age of death for a hypothetical cohort of newborns if they experienced the age-specific mortality rates of one particular year throughout their entire lives. It's a snapshot reflecting mortality rates in a given year that does not account for any future changes in those rates.
Healthy life expectancy at birth, defined by the World Health Organization as the average number of years a person can expect to live in full health, is 54.9 years in Nigeria and 69.4 in Slovenia. People who reach age 60 can expect an additional 14 healthy years in Nigeria and 17 in Slovenia.
Nigeria vs Slovenia life expectancy calculator
This life expectancy calculator shows the odds of living to 100, 95, 90, and below based on current age for both males and females in Nigeria and Slovenia, along with mean and median age of death. The calculations are based on the 2026 life tables (actuarial tables) from the UN World Population Prospects.
Mean remaining life expectancy:
37.2
vs
52.5
years
Mean expected age of death:
67.2
vs
82.5
years
Median expected age of death:
70.1
vs
84.5
years
Odds of living to
| Target age | Survival probability | |||
|---|---|---|---|---|
| Nigeria | Slovenia | |||
| Male | Female | Male | Female | |
| 40 | 93.0% | 92.6% | 99.3% | 99.7% |
| 50 | 83.9% | 83.9% | 97.8% | 98.9% |
| 60 | 70.5% | 71.9% | 92.9% | 96.5% |
| 65 | 61.0% | 63.0% | 88.1% | 94.1% |
| 70 | 49.2% | 51.4% | 81.3% | 90.6% |
| 75 | 35.2% | 37.2% | 72.1% | 85.3% |
| 80 | 20.8% | 22.5% | 57.3% | 74.5% |
| 85 | 9.2% | 10.2% | 38.8% | 57.5% |
| 90 | 2.5% | 3.2% | 20.2% | 35.7% |
| 95 | 0.3% | 0.5% | 7.1% | 15.3% |
| 100 | 0.0% | 0.0% | 1.5% | 3.7% |
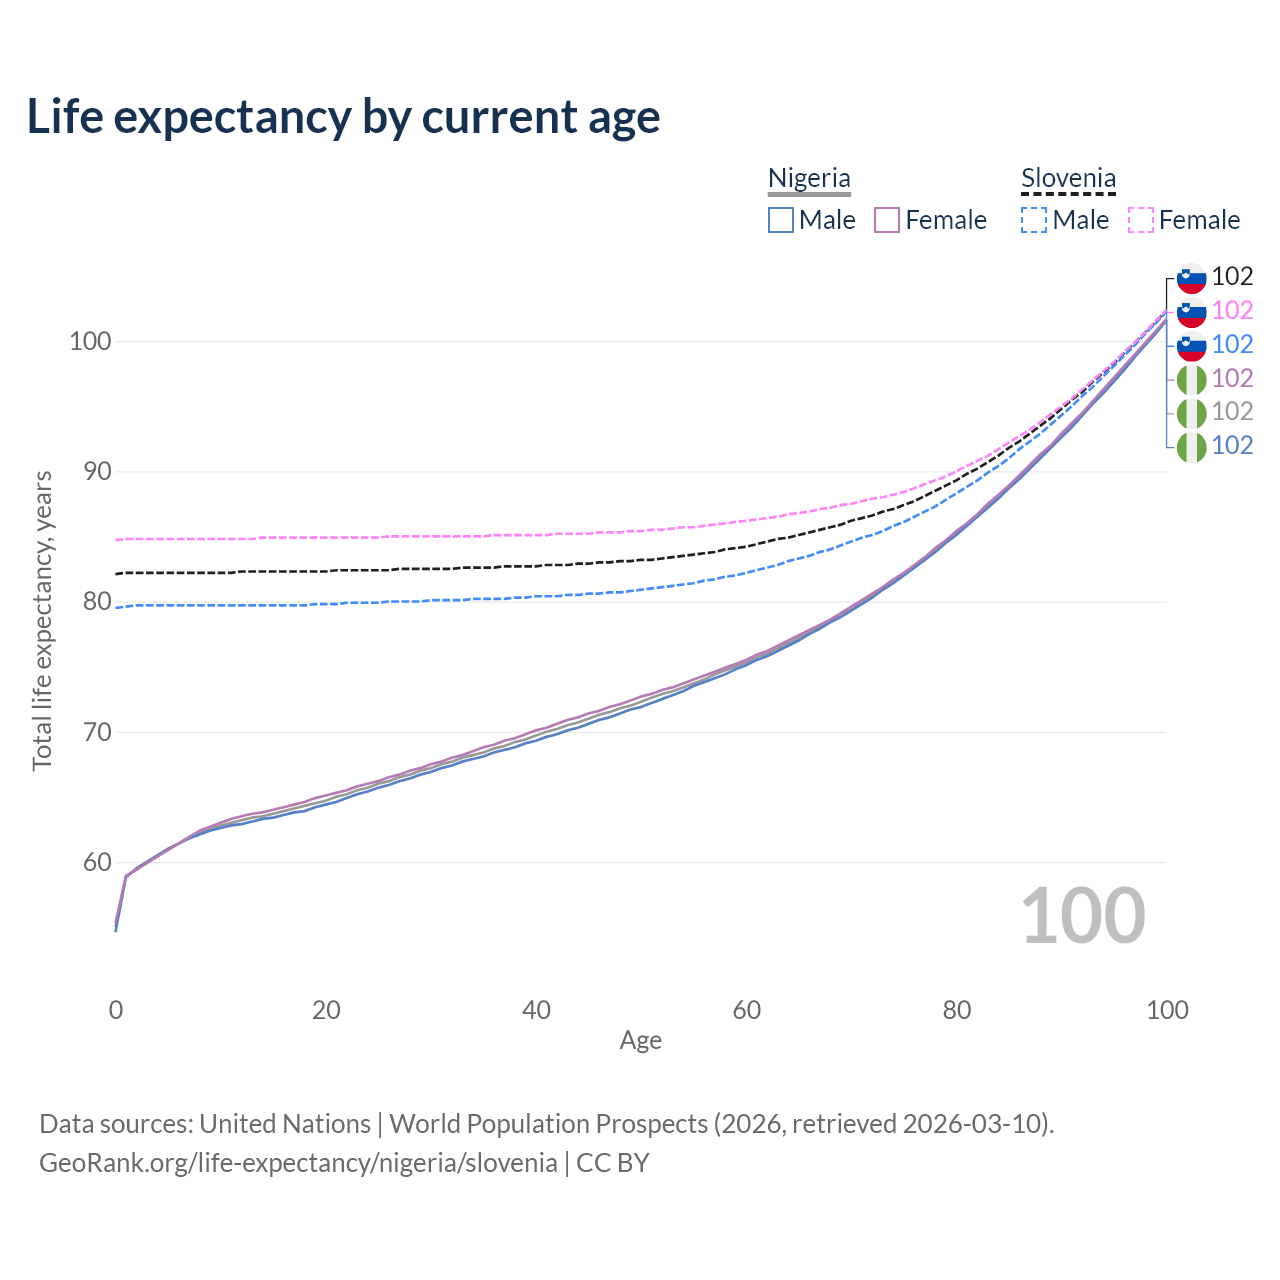
Life expectancy by current age
| Current age, years | Total life expectancy, years | |||||
|---|---|---|---|---|---|---|
|
Nigeria
|
Slovenia
|
|||||
| Average | Male | Female | Average | Male | Female | |
| 100 | 101.6 | 101.6 | 101.7 | 102.4 | 102.3 | 102.4 |
| 99 | 100.7 | 100.6 | 100.8 | 101.5 | 101.4 | 101.6 |
| 98 | 99.8 | 99.7 | 99.9 | 100.7 | 100.6 | 100.7 |
| 97 | 98.9 | 98.8 | 99 | 99.9 | 99.7 | 99.9 |
| 96 | 98 | 97.8 | 98.1 | 99.1 | 98.9 | 99.2 |
| 95 | 97.1 | 96.9 | 97.2 | 98.3 | 98.1 | 98.4 |
| 94 | 96.2 | 96 | 96.3 | 97.6 | 97.3 | 97.7 |
| 93 | 95.3 | 95.2 | 95.4 | 96.9 | 96.5 | 97 |
| 92 | 94.4 | 94.3 | 94.5 | 96.1 | 95.8 | 96.3 |
| 91 | 93.6 | 93.4 | 93.7 | 95.5 | 95 | 95.6 |
| 90 | 92.7 | 92.6 | 92.9 | 94.8 | 94.3 | 95 |
| 89 | 91.9 | 91.8 | 92 | 94.1 | 93.6 | 94.4 |
| 88 | 91.1 | 91 | 91.3 | 93.5 | 92.9 | 93.8 |
| 87 | 90.3 | 90.2 | 90.5 | 92.9 | 92.3 | 93.2 |
| 86 | 89.6 | 89.4 | 89.7 | 92.3 | 91.7 | 92.7 |
| 85 | 88.8 | 88.7 | 88.9 | 91.8 | 91 | 92.2 |
| 84 | 88.1 | 87.9 | 88.2 | 91.2 | 90.4 | 91.7 |
| 83 | 87.3 | 87.2 | 87.5 | 90.7 | 89.9 | 91.2 |
| 82 | 86.6 | 86.5 | 86.7 | 90.2 | 89.3 | 90.8 |
| 81 | 85.9 | 85.8 | 86 | 89.8 | 88.8 | 90.4 |
| 80 | 85.2 | 85.1 | 85.4 | 89.3 | 88.3 | 90 |
| 79 | 84.6 | 84.5 | 84.7 | 88.9 | 87.8 | 89.6 |
| 78 | 83.9 | 83.8 | 84.1 | 88.5 | 87.3 | 89.3 |
| 77 | 83.3 | 83.2 | 83.4 | 88.1 | 86.9 | 89 |
| 76 | 82.7 | 82.6 | 82.8 | 87.7 | 86.5 | 88.7 |
| 75 | 82.1 | 82 | 82.2 | 87.4 | 86.1 | 88.4 |
| 74 | 81.6 | 81.4 | 81.7 | 87.1 | 85.8 | 88.2 |
| 73 | 81 | 80.9 | 81.1 | 86.9 | 85.4 | 88 |
| 72 | 80.5 | 80.3 | 80.6 | 86.6 | 85.1 | 87.9 |
| 71 | 79.9 | 79.8 | 80.1 | 86.4 | 84.9 | 87.7 |
| 70 | 79.4 | 79.3 | 79.6 | 86.2 | 84.6 | 87.5 |
| 69 | 79 | 78.8 | 79.1 | 85.9 | 84.3 | 87.4 |
| 68 | 78.5 | 78.4 | 78.6 | 85.7 | 84 | 87.2 |
| 67 | 78.1 | 77.9 | 78.2 | 85.5 | 83.8 | 87.1 |
| 66 | 77.6 | 77.5 | 77.8 | 85.3 | 83.5 | 86.9 |
| 65 | 77.2 | 77 | 77.4 | 85.1 | 83.3 | 86.8 |
| 64 | 76.8 | 76.6 | 77 | 84.9 | 83.1 | 86.7 |
| 63 | 76.4 | 76.2 | 76.6 | 84.8 | 82.8 | 86.5 |
| 62 | 76 | 75.8 | 76.2 | 84.6 | 82.6 | 86.4 |
| 61 | 75.7 | 75.5 | 75.9 | 84.4 | 82.4 | 86.3 |
| 60 | 75.3 | 75.1 | 75.5 | 84.2 | 82.2 | 86.2 |
| 59 | 75 | 74.8 | 75.2 | 84.1 | 82 | 86.1 |
| 58 | 74.7 | 74.4 | 74.9 | 84 | 81.9 | 86 |
| 57 | 74.4 | 74.1 | 74.6 | 83.8 | 81.7 | 85.9 |
| 56 | 74 | 73.8 | 74.3 | 83.7 | 81.6 | 85.8 |
| 55 | 73.7 | 73.5 | 74 | 83.6 | 81.4 | 85.7 |
| 54 | 73.4 | 73.1 | 73.7 | 83.5 | 81.3 | 85.7 |
| 53 | 73.1 | 72.8 | 73.4 | 83.4 | 81.2 | 85.6 |
| 52 | 72.9 | 72.5 | 73.2 | 83.3 | 81.1 | 85.5 |
| 51 | 72.6 | 72.2 | 72.9 | 83.2 | 81 | 85.5 |
| 50 | 72.3 | 71.9 | 72.7 | 83.2 | 80.9 | 85.4 |
| 49 | 72 | 71.7 | 72.4 | 83.1 | 80.8 | 85.4 |
| 48 | 71.8 | 71.4 | 72.1 | 83.1 | 80.7 | 85.3 |
| 47 | 71.5 | 71.1 | 71.9 | 83 | 80.7 | 85.3 |
| 46 | 71.3 | 70.9 | 71.6 | 83 | 80.6 | 85.3 |
| 45 | 71 | 70.6 | 71.4 | 82.9 | 80.6 | 85.2 |
| 44 | 70.7 | 70.3 | 71.1 | 82.9 | 80.5 | 85.2 |
| 43 | 70.5 | 70.1 | 70.9 | 82.8 | 80.5 | 85.2 |
| 42 | 70.2 | 69.8 | 70.6 | 82.8 | 80.4 | 85.2 |
| 41 | 70 | 69.6 | 70.3 | 82.8 | 80.4 | 85.1 |
| 40 | 69.7 | 69.3 | 70.1 | 82.7 | 80.4 | 85.1 |
| 39 | 69.4 | 69.1 | 69.8 | 82.7 | 80.3 | 85.1 |
| 38 | 69.2 | 68.8 | 69.5 | 82.7 | 80.3 | 85.1 |
| 37 | 68.9 | 68.6 | 69.3 | 82.7 | 80.2 | 85.1 |
| 36 | 68.7 | 68.4 | 69 | 82.6 | 80.2 | 85.1 |
| 35 | 68.4 | 68.1 | 68.8 | 82.6 | 80.2 | 85 |
| 34 | 68.2 | 67.9 | 68.5 | 82.6 | 80.2 | 85 |
| 33 | 68 | 67.7 | 68.2 | 82.6 | 80.1 | 85 |
| 32 | 67.7 | 67.4 | 68 | 82.5 | 80.1 | 85 |
| 31 | 67.5 | 67.2 | 67.7 | 82.5 | 80.1 | 85 |
| 30 | 67.2 | 66.9 | 67.5 | 82.5 | 80.1 | 85 |
| 29 | 67 | 66.7 | 67.2 | 82.5 | 80 | 85 |
| 28 | 66.7 | 66.4 | 67 | 82.5 | 80 | 85 |
| 27 | 66.5 | 66.2 | 66.7 | 82.5 | 80 | 85 |
| 26 | 66.2 | 65.9 | 66.5 | 82.4 | 80 | 85 |
| 25 | 66 | 65.7 | 66.2 | 82.4 | 79.9 | 84.9 |
| 24 | 65.7 | 65.4 | 66 | 82.4 | 79.9 | 84.9 |
| 23 | 65.5 | 65.2 | 65.8 | 82.4 | 79.9 | 84.9 |
| 22 | 65.2 | 64.9 | 65.5 | 82.4 | 79.9 | 84.9 |
| 21 | 65 | 64.6 | 65.3 | 82.4 | 79.8 | 84.9 |
| 20 | 64.7 | 64.4 | 65.1 | 82.3 | 79.8 | 84.9 |
| 19 | 64.5 | 64.2 | 64.9 | 82.3 | 79.8 | 84.9 |
| 18 | 64.3 | 63.9 | 64.6 | 82.3 | 79.7 | 84.9 |
| 17 | 64.1 | 63.8 | 64.4 | 82.3 | 79.7 | 84.9 |
| 16 | 63.9 | 63.6 | 64.2 | 82.3 | 79.7 | 84.9 |
| 15 | 63.7 | 63.4 | 64 | 82.3 | 79.7 | 84.9 |
| 14 | 63.5 | 63.3 | 63.8 | 82.3 | 79.7 | 84.9 |
| 13 | 63.4 | 63.1 | 63.7 | 82.3 | 79.7 | 84.8 |
| 12 | 63.2 | 62.9 | 63.5 | 82.3 | 79.7 | 84.8 |
| 11 | 63 | 62.8 | 63.3 | 82.2 | 79.7 | 84.8 |
| 10 | 62.8 | 62.6 | 63 | 82.2 | 79.7 | 84.8 |
| 9 | 62.5 | 62.4 | 62.7 | 82.2 | 79.7 | 84.8 |
| 8 | 62.2 | 62.1 | 62.4 | 82.2 | 79.7 | 84.8 |
| 7 | 61.9 | 61.8 | 61.9 | 82.2 | 79.7 | 84.8 |
| 6 | 61.4 | 61.4 | 61.4 | 82.2 | 79.7 | 84.8 |
| 5 | 61 | 61 | 60.9 | 82.2 | 79.7 | 84.8 |
| 4 | 60.5 | 60.5 | 60.4 | 82.2 | 79.7 | 84.8 |
| 3 | 60 | 60 | 59.9 | 82.2 | 79.7 | 84.8 |
| 2 | 59.4 | 59.5 | 59.4 | 82.2 | 79.7 | 84.8 |
| 1 | 58.9 | 58.8 | 58.9 | 82.2 | 79.6 | 84.8 |
| 0 | 55 | 54.6 | 55.3 | 82.1 | 79.5 | 84.7 |
Data sources: United Nations | World Population Prospects (2026, retrieved 2026-07-08).
GeoRank.org/life-expectancy/nigeria/slovenia | CC BY
Life expectancy is often mistaken for the average lifespan of an adult. However, an adult has already survived the causes of early-age mortality and can expect to live longer than the figure calculated at birth.
A 30-year-old in Nigeria can expect to live to 67.2 years compared to 82.5 in Slovenia, rising to 77.2 and 85.1 at 65, and to 85.2 and 89.3 at 80 — higher than the 55 and 82.1 years calculated at birth.
The chart above accounts for remaining lifespan and displays total life expectancy by age and gender in Nigeria and Slovenia.
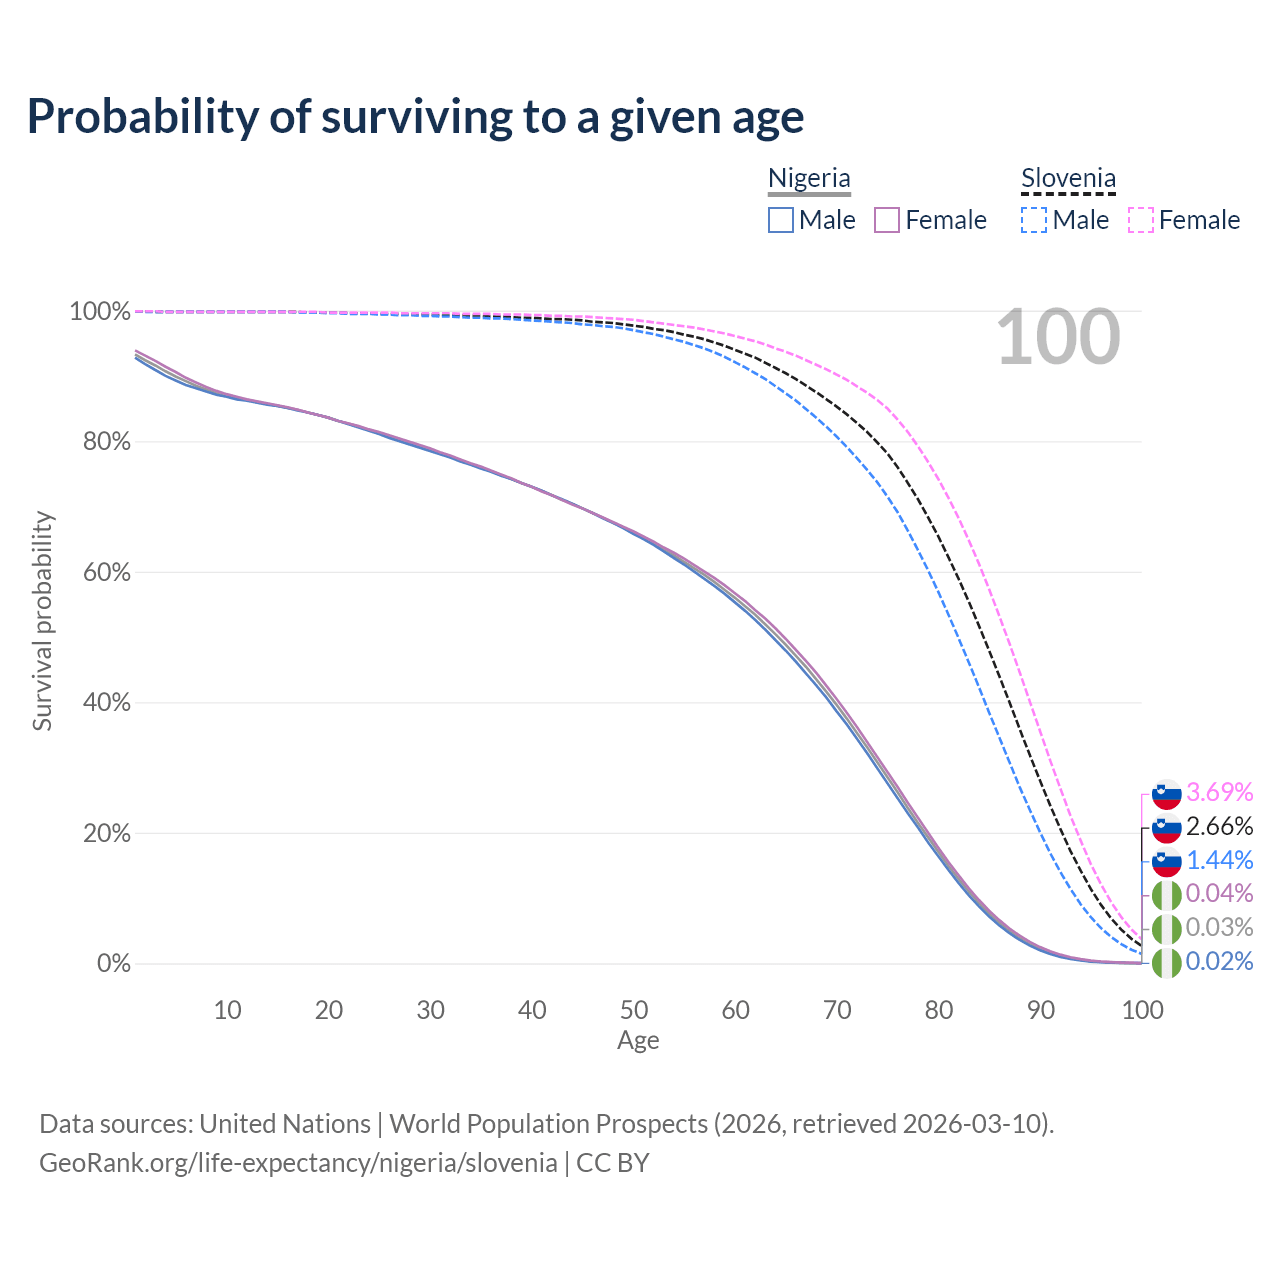
Probability of surviving to a given age
| Age | Survival probability | |||||
|---|---|---|---|---|---|---|
|
Nigeria
|
Slovenia
|
|||||
| Average | Male | Female | Average | Male | Female | |
| 100 | 0.03% | 0.02% | 0.04% | 2.66% | 1.44% | 3.69% |
| 99 | 0.05% | 0.03% | 0.07% | 3.75% | 2.08% | 5.18% |
| 98 | 0.08% | 0.06% | 0.11% | 5.15% | 2.93% | 7.07% |
| 97 | 0.14% | 0.1% | 0.18% | 6.88% | 4.03% | 9.37% |
| 96 | 0.22% | 0.17% | 0.28% | 8.95% | 5.4% | 12.1% |
| 95 | 0.35% | 0.27% | 0.42% | 11.4% | 7.07% | 15.2% |
| 94 | 0.54% | 0.43% | 0.64% | 14.2% | 9.05% | 18.8% |
| 93 | 0.8% | 0.66% | 0.93% | 17.2% | 11.4% | 22.6% |
| 92 | 1.16% | 0.98% | 1.33% | 20.6% | 14% | 26.8% |
| 91 | 1.63% | 1.42% | 1.84% | 24.2% | 16.9% | 31.1% |
| 90 | 2.24% | 1.99% | 2.49% | 28% | 20.1% | 35.6% |
| 89 | 3% | 2.71% | 3.28% | 31.9% | 23.5% | 40.1% |
| 88 | 3.91% | 3.58% | 4.23% | 35.9% | 27% | 44.6% |
| 87 | 4.98% | 4.61% | 5.34% | 40% | 30.8% | 49% |
| 86 | 6.22% | 5.81% | 6.62% | 44% | 34.6% | 53.2% |
| 85 | 7.63% | 7.19% | 8.07% | 47.9% | 38.4% | 57.3% |
| 84 | 9.22% | 8.73% | 9.7% | 51.7% | 42.3% | 61.2% |
| 83 | 11% | 10.4% | 11.5% | 55.4% | 46.1% | 64.8% |
| 82 | 12.9% | 12.3% | 13.5% | 58.9% | 49.8% | 68.2% |
| 81 | 14.9% | 14.3% | 15.5% | 62.2% | 53.4% | 71.3% |
| 80 | 17.1% | 16.4% | 17.7% | 65.4% | 56.9% | 74.2% |
| 79 | 19.3% | 18.5% | 20% | 68.3% | 60.2% | 76.8% |
| 78 | 21.5% | 20.8% | 22.3% | 71.1% | 63.3% | 79.2% |
| 77 | 23.8% | 23% | 24.6% | 73.6% | 66.3% | 81.4% |
| 76 | 26.2% | 25.3% | 27% | 76% | 69.1% | 83.3% |
| 75 | 28.5% | 27.6% | 29.3% | 78.1% | 71.5% | 85% |
| 74 | 30.8% | 29.9% | 31.6% | 79.8% | 73.7% | 86.3% |
| 73 | 33.1% | 32.2% | 33.9% | 81.4% | 75.6% | 87.4% |
| 72 | 35.3% | 34.4% | 36.2% | 82.8% | 77.4% | 88.4% |
| 71 | 37.5% | 36.6% | 38.4% | 84.1% | 79.1% | 89.4% |
| 70 | 39.6% | 38.6% | 40.5% | 85.3% | 80.7% | 90.2% |
| 69 | 41.6% | 40.7% | 42.5% | 86.4% | 82.2% | 91% |
| 68 | 43.5% | 42.6% | 44.5% | 87.5% | 83.6% | 91.7% |
| 67 | 45.4% | 44.4% | 46.3% | 88.5% | 84.9% | 92.4% |
| 66 | 47.1% | 46.2% | 48% | 89.5% | 86.2% | 93.1% |
| 65 | 48.8% | 47.9% | 49.7% | 90.4% | 87.3% | 93.7% |
| 64 | 50.4% | 49.5% | 51.3% | 91.2% | 88.4% | 94.2% |
| 63 | 51.9% | 51.1% | 52.8% | 92% | 89.5% | 94.8% |
| 62 | 53.4% | 52.6% | 54.1% | 92.8% | 90.4% | 95.3% |
| 61 | 54.7% | 54% | 55.5% | 93.4% | 91.3% | 95.7% |
| 60 | 56% | 55.3% | 56.7% | 94% | 92.1% | 96.1% |
| 59 | 57.2% | 56.6% | 57.9% | 94.6% | 92.9% | 96.5% |
| 58 | 58.4% | 57.8% | 59% | 95.1% | 93.6% | 96.8% |
| 57 | 59.5% | 58.9% | 60% | 95.6% | 94.2% | 97.1% |
| 56 | 60.5% | 60% | 61% | 96% | 94.7% | 97.4% |
| 55 | 61.5% | 61.1% | 62% | 96.3% | 95.2% | 97.6% |
| 54 | 62.5% | 62.1% | 62.9% | 96.7% | 95.6% | 97.8% |
| 53 | 63.4% | 63.1% | 63.7% | 97% | 96% | 98% |
| 52 | 64.3% | 64.1% | 64.6% | 97.2% | 96.4% | 98.2% |
| 51 | 65.2% | 65% | 65.4% | 97.5% | 96.7% | 98.4% |
| 50 | 66% | 65.8% | 66.2% | 97.7% | 97% | 98.6% |
| 49 | 66.8% | 66.7% | 66.9% | 97.9% | 97.3% | 98.7% |
| 48 | 67.5% | 67.5% | 67.6% | 98.1% | 97.5% | 98.8% |
| 47 | 68.3% | 68.2% | 68.3% | 98.2% | 97.6% | 98.9% |
| 46 | 69% | 69% | 69% | 98.3% | 97.8% | 99% |
| 45 | 69.7% | 69.7% | 69.7% | 98.5% | 97.9% | 99.1% |
| 44 | 70.4% | 70.4% | 70.3% | 98.6% | 98.1% | 99.1% |
| 43 | 71% | 71.1% | 71% | 98.7% | 98.2% | 99.2% |
| 42 | 71.7% | 71.7% | 71.7% | 98.7% | 98.3% | 99.2% |
| 41 | 72.4% | 72.4% | 72.3% | 98.8% | 98.4% | 99.3% |
| 40 | 73% | 73% | 73% | 98.9% | 98.5% | 99.3% |
| 39 | 73.6% | 73.6% | 73.6% | 98.9% | 98.6% | 99.4% |
| 38 | 74.2% | 74.2% | 74.3% | 99% | 98.7% | 99.4% |
| 37 | 74.8% | 74.7% | 74.9% | 99.1% | 98.8% | 99.4% |
| 36 | 75.4% | 75.3% | 75.5% | 99.1% | 98.8% | 99.5% |
| 35 | 76% | 75.8% | 76.1% | 99.2% | 98.9% | 99.5% |
| 34 | 76.5% | 76.4% | 76.6% | 99.2% | 98.9% | 99.5% |
| 33 | 77.1% | 76.9% | 77.2% | 99.3% | 99% | 99.5% |
| 32 | 77.6% | 77.5% | 77.8% | 99.3% | 99.1% | 99.6% |
| 31 | 78.1% | 78% | 78.3% | 99.3% | 99.1% | 99.6% |
| 30 | 78.7% | 78.5% | 78.9% | 99.4% | 99.2% | 99.6% |
| 29 | 79.2% | 79% | 79.4% | 99.4% | 99.2% | 99.6% |
| 28 | 79.7% | 79.5% | 79.9% | 99.4% | 99.3% | 99.6% |
| 27 | 80.2% | 80% | 80.4% | 99.5% | 99.3% | 99.6% |
| 26 | 80.7% | 80.5% | 80.9% | 99.5% | 99.4% | 99.7% |
| 25 | 81.2% | 81.1% | 81.4% | 99.5% | 99.4% | 99.7% |
| 24 | 81.7% | 81.6% | 81.8% | 99.6% | 99.5% | 99.7% |
| 23 | 82.2% | 82.1% | 82.3% | 99.6% | 99.5% | 99.7% |
| 22 | 82.7% | 82.6% | 82.7% | 99.6% | 99.5% | 99.7% |
| 21 | 83.1% | 83.1% | 83.1% | 99.7% | 99.6% | 99.7% |
| 20 | 83.6% | 83.6% | 83.6% | 99.7% | 99.6% | 99.7% |
| 19 | 84% | 84% | 84% | 99.7% | 99.7% | 99.8% |
| 18 | 84.4% | 84.4% | 84.4% | 99.7% | 99.7% | 99.8% |
| 17 | 84.8% | 84.7% | 84.8% | 99.8% | 99.7% | 99.8% |
| 16 | 85.1% | 85.1% | 85.2% | 99.8% | 99.8% | 99.8% |
| 15 | 85.4% | 85.4% | 85.5% | 99.8% | 99.8% | 99.8% |
| 14 | 85.7% | 85.6% | 85.8% | 99.8% | 99.8% | 99.8% |
| 13 | 86% | 85.9% | 86.1% | 99.8% | 99.8% | 99.8% |
| 12 | 86.3% | 86.2% | 86.4% | 99.8% | 99.8% | 99.8% |
| 11 | 86.6% | 86.4% | 86.8% | 99.8% | 99.8% | 99.8% |
| 10 | 87% | 86.8% | 87.2% | 99.8% | 99.8% | 99.8% |
| 9 | 87.4% | 87.1% | 87.7% | 99.8% | 99.8% | 99.8% |
| 8 | 87.9% | 87.6% | 88.3% | 99.8% | 99.8% | 99.8% |
| 7 | 88.5% | 88.1% | 89% | 99.8% | 99.8% | 99.8% |
| 6 | 89.2% | 88.6% | 89.7% | 99.8% | 99.8% | 99.8% |
| 5 | 89.9% | 89.3% | 90.6% | 99.8% | 99.8% | 99.8% |
| 4 | 90.7% | 90% | 91.4% | 99.8% | 99.8% | 99.8% |
| 3 | 91.6% | 90.9% | 92.3% | 99.8% | 99.8% | 99.9% |
| 2 | 92.4% | 91.8% | 93.1% | 99.9% | 99.8% | 99.9% |
| 1 | 93.3% | 92.8% | 93.9% | 99.9% | 99.9% | 99.9% |
Data sources: United Nations | World Population Prospects (2026, retrieved 2026-07-08).
GeoRank.org/life-expectancy/nigeria/slovenia | CC BY
This chart shows the odds of living to each age from birth. 56% of newborns in Nigeria and 94% in Slovenia are expected to live past 60, 39.6% and 85.3% past 70, 17.1% and 65.4% past 80, and only 2.24% and 28% past 90.
For longevity rates starting from a different age, use the calculator provided above.
Compare countries by 7 more topics
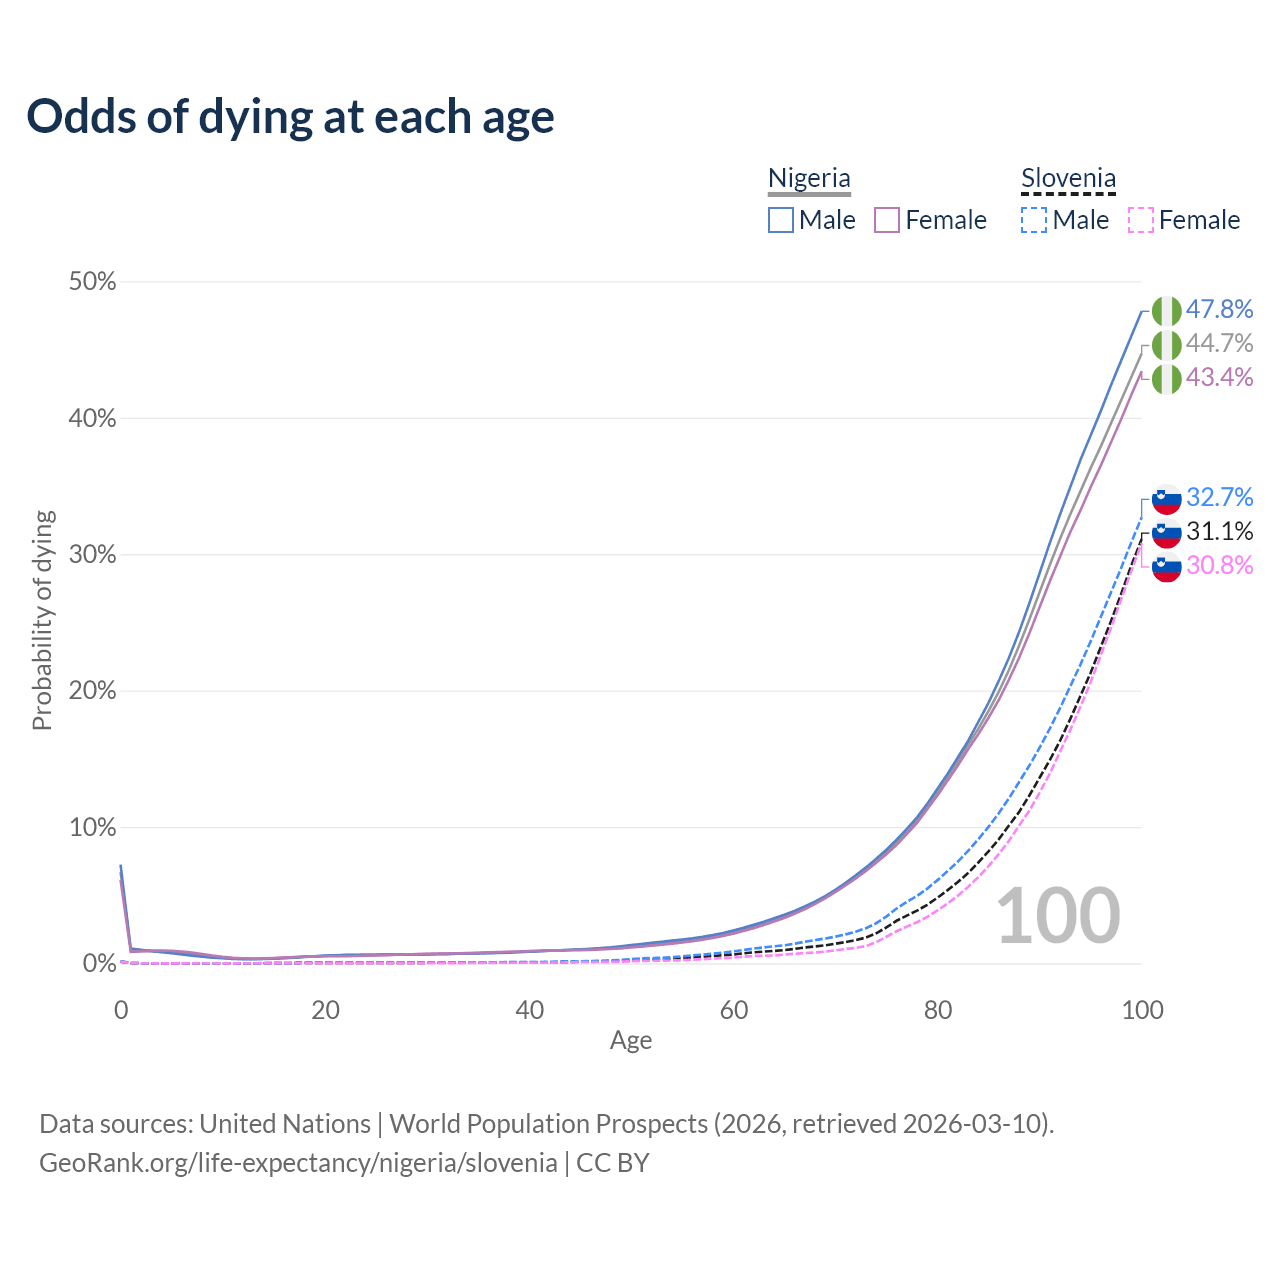
Odds of dying at each age
| Age | Probability of dying | |||||
|---|---|---|---|---|---|---|
|
Nigeria
|
Slovenia
|
|||||
| Average | Male | Female | Average | Male | Female | |
| 100 | 44.7% | 47.8% | 43.4% | 31.1% | 32.7% | 30.8% |
| 99 | 43% | 46% | 41.7% | 29.2% | 30.9% | 28.8% |
| 98 | 41.3% | 44.2% | 39.9% | 27.1% | 29% | 26.7% |
| 97 | 39.6% | 42.4% | 38.2% | 25.1% | 27.2% | 24.6% |
| 96 | 37.9% | 40.5% | 36.5% | 23.2% | 25.4% | 22.6% |
| 95 | 36.3% | 38.7% | 34.9% | 21.3% | 23.6% | 20.6% |
| 94 | 34.6% | 36.9% | 33.2% | 19.6% | 21.9% | 18.8% |
| 93 | 32.9% | 34.9% | 31.6% | 17.9% | 20.3% | 17.1% |
| 92 | 31.1% | 32.9% | 29.8% | 16.3% | 18.7% | 15.5% |
| 91 | 29.2% | 30.8% | 28% | 14.9% | 17.2% | 13.9% |
| 90 | 27.2% | 28.6% | 26.1% | 13.6% | 15.8% | 12.5% |
| 89 | 25.2% | 26.4% | 24.2% | 12.3% | 14.5% | 11.2% |
| 88 | 23.3% | 24.3% | 22.4% | 11.1% | 13.3% | 10.1% |
| 87 | 21.5% | 22.4% | 20.8% | 10.1% | 12.1% | 8.98% |
| 86 | 19.9% | 20.7% | 19.3% | 9.09% | 11% | 8% |
| 85 | 18.5% | 19.1% | 18% | 8.21% | 10% | 7.12% |
| 84 | 17.2% | 17.7% | 16.8% | 7.39% | 9.1% | 6.32% |
| 83 | 16% | 16.3% | 15.7% | 6.62% | 8.24% | 5.6% |
| 82 | 14.8% | 15.1% | 14.5% | 5.96% | 7.46% | 4.96% |
| 81 | 13.7% | 13.9% | 13.4% | 5.37% | 6.76% | 4.39% |
| 80 | 12.5% | 12.8% | 12.3% | 4.81% | 6.1% | 3.88% |
| 79 | 11.5% | 11.7% | 11.3% | 4.29% | 5.48% | 3.41% |
| 78 | 10.5% | 10.7% | 10.3% | 3.86% | 4.94% | 3.01% |
| 77 | 9.65% | 9.86% | 9.47% | 3.5% | 4.51% | 2.69% |
| 76 | 8.86% | 9.06% | 8.69% | 3.12% | 4.02% | 2.35% |
| 75 | 8.15% | 8.33% | 8% | 2.63% | 3.43% | 1.95% |
| 74 | 7.5% | 7.66% | 7.37% | 2.2% | 2.94% | 1.55% |
| 73 | 6.9% | 7.03% | 6.78% | 1.89% | 2.58% | 1.27% |
| 72 | 6.33% | 6.45% | 6.23% | 1.7% | 2.32% | 1.13% |
| 71 | 5.8% | 5.9% | 5.71% | 1.56% | 2.12% | 1.05% |
| 70 | 5.3% | 5.39% | 5.22% | 1.44% | 1.96% | 0.95% |
| 69 | 4.84% | 4.93% | 4.76% | 1.32% | 1.82% | 0.86% |
| 68 | 4.43% | 4.52% | 4.34% | 1.24% | 1.7% | 0.79% |
| 67 | 4.06% | 4.16% | 3.97% | 1.16% | 1.58% | 0.75% |
| 66 | 3.73% | 3.84% | 3.63% | 1.06% | 1.44% | 0.7% |
| 65 | 3.44% | 3.56% | 3.33% | 0.97% | 1.32% | 0.64% |
| 64 | 3.18% | 3.3% | 3.06% | 0.91% | 1.25% | 0.58% |
| 63 | 2.93% | 3.05% | 2.81% | 0.86% | 1.17% | 0.56% |
| 62 | 2.7% | 2.82% | 2.58% | 0.81% | 1.08% | 0.54% |
| 61 | 2.49% | 2.6% | 2.37% | 0.73% | 0.98% | 0.48% |
| 60 | 2.29% | 2.4% | 2.18% | 0.65% | 0.88% | 0.42% |
| 59 | 2.12% | 2.22% | 2.01% | 0.59% | 0.79% | 0.38% |
| 58 | 1.97% | 2.07% | 1.87% | 0.53% | 0.71% | 0.35% |
| 57 | 1.84% | 1.94% | 1.74% | 0.48% | 0.64% | 0.31% |
| 56 | 1.73% | 1.83% | 1.63% | 0.43% | 0.58% | 0.27% |
| 55 | 1.64% | 1.74% | 1.54% | 0.38% | 0.51% | 0.23% |
| 54 | 1.56% | 1.66% | 1.45% | 0.34% | 0.45% | 0.21% |
| 53 | 1.48% | 1.58% | 1.37% | 0.31% | 0.4% | 0.2% |
| 52 | 1.4% | 1.5% | 1.3% | 0.29% | 0.38% | 0.19% |
| 51 | 1.32% | 1.41% | 1.23% | 0.27% | 0.36% | 0.18% |
| 50 | 1.24% | 1.33% | 1.16% | 0.23% | 0.3% | 0.15% |
| 49 | 1.17% | 1.25% | 1.1% | 0.19% | 0.25% | 0.12% |
| 48 | 1.11% | 1.17% | 1.05% | 0.16% | 0.21% | 0.11% |
| 47 | 1.07% | 1.11% | 1.02% | 0.14% | 0.18% | 0.1% |
| 46 | 1.03% | 1.07% | 0.99% | 0.13% | 0.16% | 0.09% |
| 45 | 1% | 1.03% | 0.97% | 0.12% | 0.15% | 0.09% |
| 44 | 0.98% | 0.99% | 0.96% | 0.11% | 0.14% | 0.07% |
| 43 | 0.95% | 0.96% | 0.95% | 0.09% | 0.12% | 0.06% |
| 42 | 0.93% | 0.93% | 0.93% | 0.08% | 0.11% | 0.05% |
| 41 | 0.9% | 0.89% | 0.92% | 0.07% | 0.1% | 0.04% |
| 40 | 0.88% | 0.85% | 0.9% | 0.07% | 0.09% | 0.04% |
| 39 | 0.85% | 0.82% | 0.87% | 0.07% | 0.1% | 0.04% |
| 38 | 0.82% | 0.79% | 0.85% | 0.07% | 0.1% | 0.04% |
| 37 | 0.79% | 0.76% | 0.82% | 0.06% | 0.08% | 0.04% |
| 36 | 0.77% | 0.74% | 0.8% | 0.05% | 0.06% | 0.03% |
| 35 | 0.75% | 0.72% | 0.77% | 0.05% | 0.06% | 0.03% |
| 34 | 0.73% | 0.71% | 0.75% | 0.05% | 0.06% | 0.03% |
| 33 | 0.71% | 0.7% | 0.73% | 0.04% | 0.06% | 0.02% |
| 32 | 0.7% | 0.68% | 0.72% | 0.04% | 0.05% | 0.02% |
| 31 | 0.69% | 0.67% | 0.7% | 0.04% | 0.06% | 0.02% |
| 30 | 0.67% | 0.66% | 0.69% | 0.04% | 0.06% | 0.02% |
| 29 | 0.66% | 0.65% | 0.67% | 0.03% | 0.05% | 0.01% |
| 28 | 0.64% | 0.64% | 0.65% | 0.03% | 0.05% | 0.01% |
| 27 | 0.63% | 0.64% | 0.63% | 0.03% | 0.05% | 0.01% |
| 26 | 0.62% | 0.64% | 0.6% | 0.03% | 0.04% | 0.01% |
| 25 | 0.61% | 0.64% | 0.58% | 0.03% | 0.04% | 0.01% |
| 24 | 0.6% | 0.64% | 0.56% | 0.03% | 0.05% | 0.02% |
| 23 | 0.59% | 0.63% | 0.54% | 0.03% | 0.04% | 0.02% |
| 22 | 0.58% | 0.62% | 0.53% | 0.03% | 0.04% | 0.01% |
| 21 | 0.56% | 0.59% | 0.53% | 0.03% | 0.04% | 0.01% |
| 20 | 0.54% | 0.56% | 0.52% | 0.03% | 0.04% | 0.01% |
| 19 | 0.51% | 0.51% | 0.51% | 0.03% | 0.05% | 0.02% |
| 18 | 0.48% | 0.47% | 0.49% | 0.03% | 0.04% | 0.01% |
| 17 | 0.44% | 0.42% | 0.46% | 0.02% | 0.03% | 0.01% |
| 16 | 0.4% | 0.38% | 0.42% | 0.01% | 0.01% | 0.01% |
| 15 | 0.36% | 0.34% | 0.39% | 0.01% | 0.01% | 0.008% |
| 14 | 0.34% | 0.32% | 0.36% | 0.009% | 0.01% | 0.007% |
| 13 | 0.33% | 0.31% | 0.35% | 0.008% | 0.008% | 0.007% |
| 12 | 0.34% | 0.31% | 0.37% | 0.006% | 0.007% | 0.005% |
| 11 | 0.37% | 0.33% | 0.4% | 0.004% | 0.006% | 0.002% |
| 10 | 0.42% | 0.37% | 0.47% | 0.004% | 0.006% | 0.002% |
| 9 | 0.49% | 0.42% | 0.56% | 0.004% | 0.004% | 0.004% |
| 8 | 0.58% | 0.49% | 0.67% | 0.006% | 0.004% | 0.008% |
| 7 | 0.67% | 0.57% | 0.78% | 0.006% | 0.004% | 0.007% |
| 6 | 0.76% | 0.65% | 0.87% | 0.003% | 0.004% | 0.002% |
| 5 | 0.83% | 0.74% | 0.92% | 0.003% | 0.004% | 0.001% |
| 4 | 0.88% | 0.82% | 0.93% | 0.004% | 0.005% | 0.002% |
| 3 | 0.91% | 0.9% | 0.91% | 0.006% | 0.006% | 0.006% |
| 2 | 0.93% | 0.99% | 0.88% | 0.008% | 0.007% | 0.009% |
| 1 | 0.96% | 1.08% | 0.84% | 0.02% | 0.02% | 0.02% |
| 0 | 6.69% | 7.24% | 6.13% | 0.13% | 0.14% | 0.12% |
Data sources: United Nations | World Population Prospects (2026, retrieved 2026-07-08).
GeoRank.org/life-expectancy/nigeria/slovenia | CC BY
This chart displays the probability of dying at any given age in Nigeria compared to Slovenia, as mortality rates vary throughout a lifetime.
The annual chance of dying is 6.69% in the birth year in Nigeria and 0.13% in Slovenia, 0.67% vs 0.04% at age 30, 2.29% vs 0.65% at 60, and 12.5% vs 4.81% at 80.
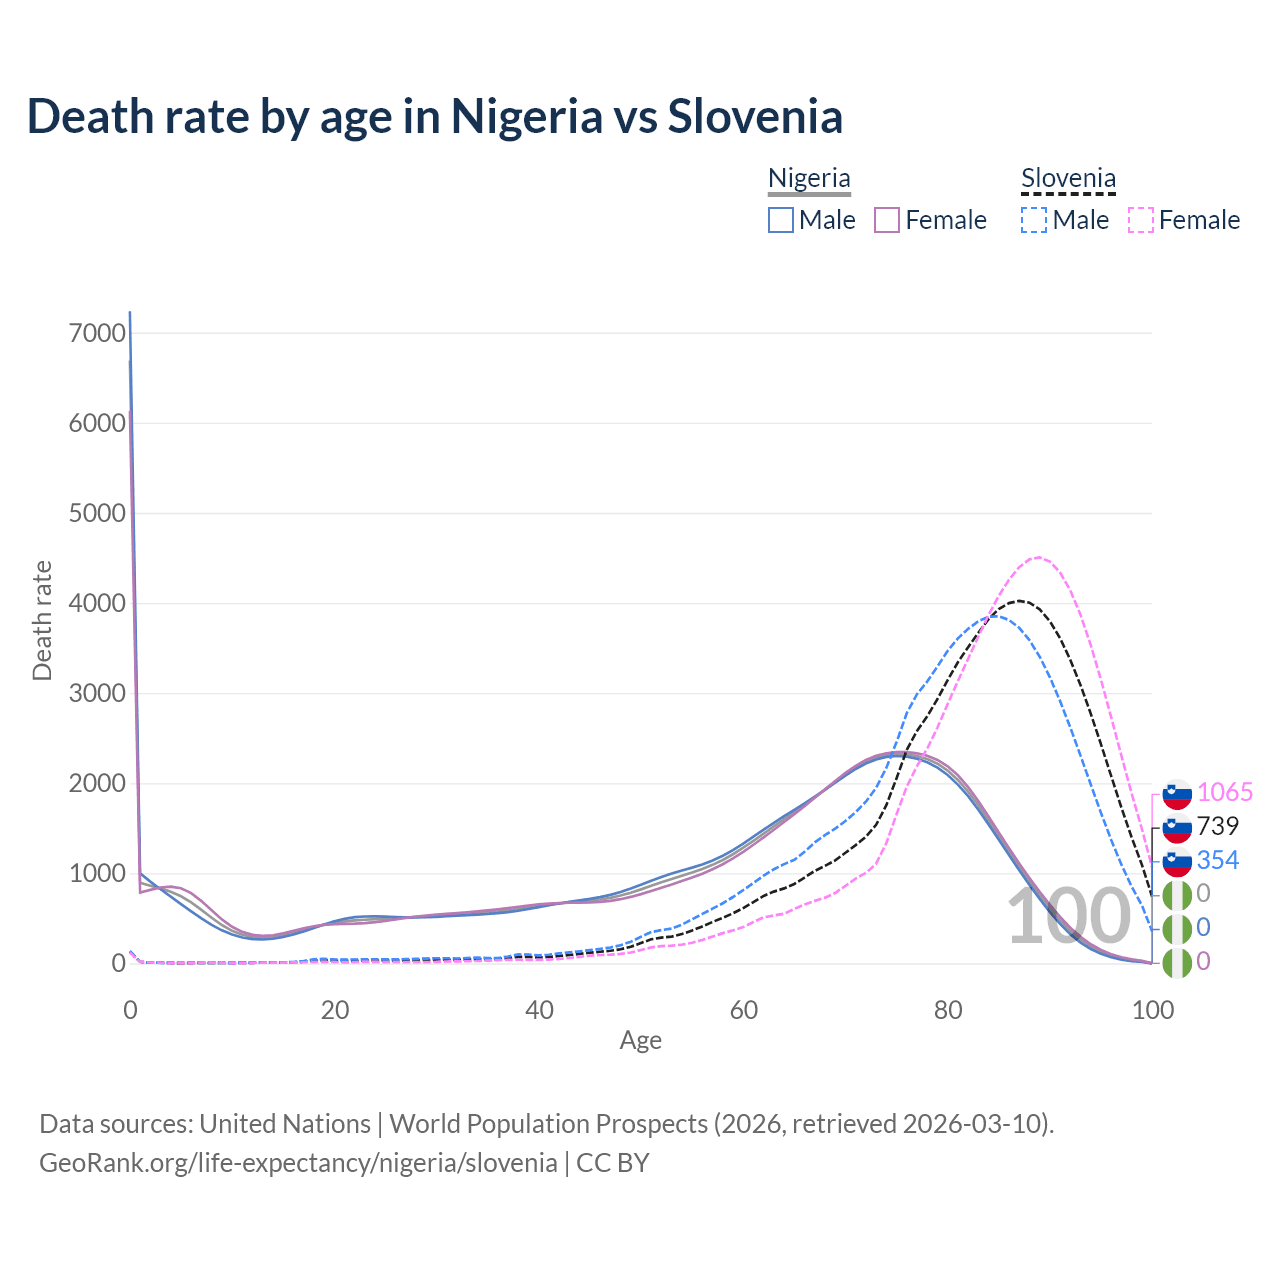
Death rate by age in Nigeria vs Slovenia
| Age | Death rate | |||||
|---|---|---|---|---|---|---|
|
Nigeria
|
Slovenia
|
|||||
| Total | Male | Female | Total | Male | Female | |
| 100 | 0 | 0 | 0 | 739 | 354 | 1,065 |
| 99 | 21.1 | 14.6 | 27.2 | 1,094 | 643 | 1,492 |
| 98 | 34.5 | 25.2 | 43.4 | 1,396 | 851 | 1,884 |
| 97 | 54.8 | 41.8 | 67.1 | 1,727 | 1,095 | 2,302 |
| 96 | 84.6 | 67.4 | 101 | 2,077 | 1,369 | 2,730 |
| 95 | 127 | 105 | 148.2 | 2,430 | 1,669 | 3,146 |
| 94 | 185.4 | 158.4 | 211.6 | 2,770 | 1,984 | 3,531 |
| 93 | 262.7 | 230.7 | 293.7 | 3,086 | 2,304 | 3,867 |
| 92 | 360 | 324 | 395 | 3,367 | 2,616 | 4,138 |
| 91 | 477 | 438 | 515 | 3,608 | 2,910 | 4,337 |
| 90 | 610 | 569 | 649 | 3,797 | 3,175 | 4,459 |
| 89 | 755 | 715 | 794 | 3,929 | 3,403 | 4,506 |
| 88 | 910 | 871 | 948 | 4,003 | 3,588 | 4,484 |
| 87 | 1,072 | 1,034 | 1,109 | 4,023 | 3,724 | 4,397 |
| 86 | 1,240 | 1,202 | 1,277 | 3,998 | 3,811 | 4,258 |
| 85 | 1,413 | 1,373 | 1,452 | 3,933 | 3,852 | 4,079 |
| 84 | 1,586 | 1,542 | 1,629 | 3,820 | 3,847 | 3,866 |
| 83 | 1,753 | 1,705 | 1,800 | 3,669 | 3,796 | 3,627 |
| 82 | 1,906 | 1,855 | 1,956 | 3,509 | 3,713 | 3,379 |
| 81 | 2,036 | 1,984 | 2,087 | 3,342 | 3,607 | 3,133 |
| 80 | 2,140 | 2,091 | 2,187 | 3,144 | 3,469 | 2,879 |
| 79 | 2,216 | 2,172 | 2,258 | 2,933 | 3,295 | 2,617 |
| 78 | 2,268 | 2,232 | 2,304 | 2,742 | 3,128 | 2,383 |
| 77 | 2,300 | 2,271 | 2,331 | 2,580 | 2,987 | 2,189 |
| 76 | 2,318 | 2,294 | 2,344 | 2,369 | 2,777 | 1,961 |
| 75 | 2,321 | 2,301 | 2,344 | 2,055 | 2,456 | 1,654 |
| 74 | 2,310 | 2,291 | 2,331 | 1,755 | 2,169 | 1,334 |
| 73 | 2,282 | 2,263 | 2,303 | 1,537 | 1,948 | 1,106 |
| 72 | 2,236 | 2,218 | 2,256 | 1,405 | 1,794 | 1,003 |
| 71 | 2,174 | 2,157 | 2,192 | 1,312 | 1,677 | 940 |
| 70 | 2,098 | 2,084 | 2,113 | 1,227 | 1,580 | 860 |
| 69 | 2,014 | 2,006 | 2,024 | 1,143 | 1,496 | 781 |
| 68 | 1,928 | 1,926 | 1,931 | 1,082 | 1,424 | 729 |
| 67 | 1,842 | 1,849 | 1,837 | 1,026 | 1,342 | 693 |
| 66 | 1,759 | 1,775 | 1,745 | 952 | 1,238 | 654 |
| 65 | 1,679 | 1,704 | 1,656 | 881 | 1,149 | 604 |
| 64 | 1,600 | 1,633 | 1,569 | 832 | 1,101 | 550 |
| 63 | 1,521 | 1,560 | 1,483 | 796 | 1,045 | 531 |
| 62 | 1,440 | 1,483 | 1,398 | 748 | 973 | 511 |
| 61 | 1,360 | 1,405 | 1,316 | 680 | 893 | 458 |
| 60 | 1,283 | 1,328 | 1,237 | 613 | 812 | 402 |
| 59 | 1,211 | 1,256 | 1,165 | 555 | 736 | 366 |
| 58 | 1,147 | 1,194 | 1,100 | 506 | 667 | 335 |
| 57 | 1,093 | 1,141 | 1,044 | 459 | 607 | 297.2 |
| 56 | 1,047 | 1,098 | 995 | 410 | 549 | 259.4 |
| 55 | 1,008 | 1,062 | 952 | 364 | 488 | 228.5 |
| 54 | 972 | 1,030 | 913 | 325 | 430 | 207.8 |
| 53 | 936 | 996 | 876 | 296.1 | 385 | 197.2 |
| 52 | 899 | 958 | 839 | 285.5 | 369 | 191.5 |
| 51 | 860 | 917 | 803 | 266.7 | 347 | 176.8 |
| 50 | 821 | 873 | 768 | 225.4 | 295.2 | 148.1 |
| 49 | 784 | 830 | 737 | 183.6 | 239.6 | 120.6 |
| 48 | 753 | 792 | 712 | 156 | 200.8 | 104.4 |
| 47 | 727 | 760 | 694 | 139.2 | 176 | 96.4 |
| 46 | 709 | 735 | 682 | 128.6 | 160.1 | 92.5 |
| 45 | 696 | 715 | 676 | 118.3 | 147.1 | 85.7 |
| 44 | 686 | 698 | 674 | 104.9 | 133.2 | 72.3 |
| 43 | 677 | 682 | 672 | 92.3 | 121.3 | 59.2 |
| 42 | 667 | 664 | 669 | 81.8 | 110.3 | 49.7 |
| 41 | 654 | 645 | 663 | 70.2 | 95.2 | 41.9 |
| 40 | 639 | 624 | 654 | 65 | 88.8 | 37.8 |
| 39 | 622 | 603 | 642 | 69.9 | 97.4 | 38.4 |
| 38 | 606 | 584 | 628 | 71.3 | 98.7 | 39.9 |
| 37 | 591 | 569 | 614 | 58.6 | 76.1 | 38.4 |
| 36 | 578 | 557 | 600 | 47.2 | 58.1 | 34.5 |
| 35 | 568 | 548 | 588 | 45.5 | 58.5 | 30.3 |
| 34 | 559 | 541 | 577 | 46.3 | 63.1 | 26.5 |
| 33 | 551 | 535 | 567 | 42.1 | 58.1 | 23.3 |
| 32 | 543 | 529 | 558 | 38.7 | 53.2 | 21.6 |
| 31 | 536 | 523 | 550 | 40 | 56.6 | 20.6 |
| 30 | 529 | 516 | 541 | 38.3 | 56.8 | 16.3 |
| 29 | 521 | 511 | 531 | 34.7 | 53 | 12.8 |
| 28 | 514 | 509 | 519 | 32.3 | 49.2 | 12.6 |
| 27 | 507 | 510 | 504 | 30.8 | 46.1 | 13.3 |
| 26 | 501 | 513 | 487 | 29.5 | 44.6 | 12.7 |
| 25 | 495 | 518 | 471 | 29.5 | 44.6 | 13.1 |
| 24 | 490 | 522 | 457 | 31.2 | 45.1 | 16.3 |
| 23 | 484 | 520 | 447 | 31.3 | 44.6 | 17.1 |
| 22 | 477 | 512 | 441 | 27.7 | 42.7 | 11.9 |
| 21 | 466 | 494 | 438 | 25.8 | 41.3 | 9.74 |
| 20 | 451 | 466 | 435 | 29.1 | 43.1 | 14.2 |
| 19 | 429 | 431 | 427 | 33 | 49 | 16 |
| 18 | 402 | 393 | 412 | 29.5 | 44.6 | 13.9 |
| 17 | 371 | 354 | 389 | 19.1 | 26.2 | 11.8 |
| 16 | 340 | 320 | 360 | 12.3 | 14.5 | 9.93 |
| 15 | 312 | 291.9 | 332 | 9.8 | 11.4 | 8.15 |
| 14 | 292.2 | 272.9 | 312 | 8.65 | 10.1 | 7.17 |
| 13 | 284.9 | 264.9 | 306 | 7.67 | 8.15 | 7.16 |
| 12 | 292.3 | 269.1 | 316 | 6 | 6.69 | 5.27 |
| 11 | 317 | 287 | 349 | 4.45 | 6.45 | 2.34 |
| 10 | 361 | 319 | 406 | 3.74 | 5.68 | 1.7 |
| 9 | 425 | 366 | 487 | 4.02 | 3.94 | 4.1 |
| 8 | 506 | 427 | 588 | 6 | 3.76 | 8.4 |
| 7 | 593 | 498 | 691 | 5.72 | 4.29 | 7.25 |
| 6 | 676 | 577 | 779 | 3.35 | 4.25 | 2.4 |
| 5 | 744 | 658 | 834 | 2.72 | 4.23 | 1.12 |
| 4 | 795 | 740 | 852 | 3.63 | 4.94 | 2.23 |
| 3 | 832 | 822 | 842 | 6.11 | 5.81 | 6.43 |
| 2 | 862 | 907 | 815 | 7.77 | 6.6 | 9.01 |
| 1 | 895 | 1,000 | 785 | 17.1 | 16.6 | 17.7 |
| 0 | 6,691 | 7,237 | 6,132 | 129.7 | 137.3 | 121.5 |
Data sources: United Nations | World Population Prospects (2026, retrieved 2026-07-08).
GeoRank.org/life-expectancy/nigeria/slovenia | CC BY
This chart shows the number of deaths by age up to 100 for 3 cohorts of 100,000 newborns each — male, female, and both combined — illustrating how expected mortality is distributed throughout life.
In Nigeria, the most common age of death is 0, compared to 87 in Slovenia. The median age of death is 64.3 in Nigeria and 84.4 in Slovenia, meaning only half of each cohort is expected to live past that age.
Note that this chart does not show rates per 100,000 population, as those would be skewed by age structure differences and reflect the demographics of Nigeria and Slovenia more than their death rates.
Life expectancy in other countries
Data sources: United Nations | World Population Prospects (1960–2026, retrieved 2026-07-08).
GeoRank.org/life-expectancy/nigeria/slovenia | CC BY
Help us show the world through your eyes
Share a photo of your city and help others discover what it looks like to live there. Your contribution makes our data come alive.
Data sources:
- United Nations | World Population Prospects (1950–2026, retrieved 2026-07-08)
- World Health Organization (WHO) | Global Health Observatory (2021, retrieved 2026-07-08)
Creative Commons Attribution (CC BY) — you’re free to copy, share, remix, adapt, and use even commercially as long as you give appropriate credit and clearly indicate if you made changes. Other sources may be subject to different license terms.